While a lot of people are making a big deal about interest payments the reality is far different. To get an accurate reading you must compare interest payments to GDP. While I agree we should not be deficit spending to infinity at the same time we must also understand where we stand right now and what the trend is. Here is the raw chart paraded.
BTC has been underperforming Gold since Dec. 2021. Since the start of the year, BTC vs Gold has been outperforming in a corrective move that has now broken a bearish structure. This chart has many implications which I won't go into now. All anyone needs to know is that Gold is better than BTC right now from a risk-reward stand point.
I see a lot of "Experts" out there all excited and trying to push another ill-informed narrative that the rise of FED's balance sheet is expanding in the same way as it did during COVID. Sorry, not even close! Don't fall for that stuff.
TSLA used to lead the NASDAQ up until Oct. 2022. Now TSLA has lost its shine as a market leader and leading the way down. Currently, TSLA/NDQ is still in the corrective phase but the writing is on the wall. Just a matter of time according to the chart.
Since the self-proclaimed monetary "expert" and Father of #MMT Warren Mosler said, "Erdogan has it right" (to lower interest rates back on March 22, 2021), the USD has appreciated by 145% against the $TRY Easy to say, not stupid enough to take his own advice & buy the $TRY Great lesson not to listen to self proclaimed "monetary experts" who could not even...
Woohoo!! 3,000 followers! A big Thank you to all. I am Humbled! Expect more good honest hard work with great risk/reward setups and more economics.
in a previous post, I covered "Home Prices Peaking Relative To Household Income" In this post we see Home prices to rent have also peaked at previous highs double peaking. The first peak was caused by lower interest rates. The second peak was caused by low rates plus Massive Deficits with helicopter money. Note how excessive deficits and lower rates since 2000...
I don't know where to start. I will say up front I have always liked NVDA. Great company, a monopoly and consistently making great products. I am a gamer. (Yes believe it or not!) So I have always been partial to NVDA. Having said that! I don't like the stock at any price, any economy, or in any market. Yes there is a great future in store for NVDA but to me it...
I think this chart is self-explanatory. Delinquency Rates have been falling to historic lows. The next move will be up. What impact will that have on the overall economy? What impact will that have on banks? What impact will it have to gov't deficits and public debt? What impact will it have on inflation? What impact will it have on the dollar? What impact will...
May Core CPI: 5.3% down -0.3% since Jan. 2023 Flattening out. Bad JUJU! Compared to the US national deficit of $426 billion for the same period last year (Oct 2021 - May 2022), our national deficit has increased by $739 billion. Current deficit $1,164,871,162,458 with 5 months left to go. Keep printing "for the people's economy!" MMT style and keep...
I know it may appear silly that I have to post this but some do not understand that Year over Year fall from 9 to 3% does not mean inflation is falling. It simply means the rate of growth has fallen. For a true fall in inflation, we would need to see YOY negative growth. Something the FED and Politicians do not want to see.
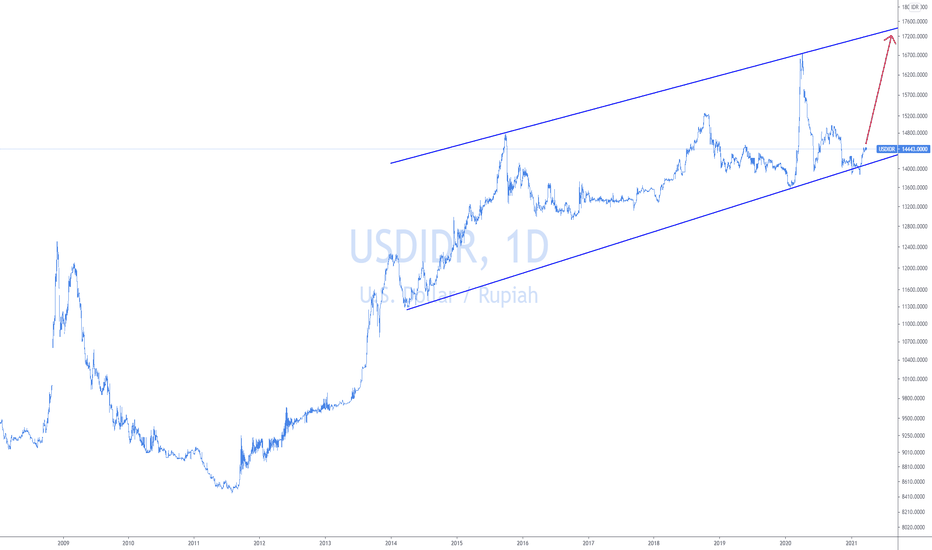
Indonesia tried to print value for the currency as #MMT prescribed. Now it costs 30,000 IDR to buy an cup of espresso! Soon it will cost 40,000 as the dollar will likely rise from here.
The real economy (Inflation adjusted) has barely grown by $1 trillion in almost 4 years. Let's take a moment and go back in time and read what the Congressional Budget Office was forecasting in 2019. "At $16.8 trillion, debt held by the public at the end of 2019 was equal to 79 percent of gross domestic product (GDP), far greater than the average debt for the...
Junk Bonds have been artificially propped up by FED buying. As inflation roars and the FED is way behind the curve, this key area breaking is not what Zombie companies want to see. Markets are in trouble. As I have been warning for months now. CAUTION!
FOMOist and buy the dippers be cautious. There are liquidation breaks and liquidations pumps (short covering) this looks like a pump to me. While we have not broken any major chart indexes to be bearish, that does not mean we won't. Yes, we are still in an uptrend. But it is funky! Obvious H&S in play for now. Looks like a backfill.
After a huge move up on very little earnings, Small caps (Risk On) have now formed a Head and Shoulders Pattern. Coupled with a number of other indexes that have hit resistance and the fact VALUE has been in vogue of late. The danger light is flashing. Head and Shoulders are continuation patterns in an uptrend and topping at all-time highs. Clearly, the H&S here...
So far so good for this vitally important Index. However, it is elevated (High basing) at the moment and that is a cause for concern. Every previous spike above zero signaled a recession. Will this time be different? Time will tell. But it is well worth your time to keep an eye on this index. As I always say no single chart is the holy grail of analysis. There...
MMT Says "PRINTING FOR THE PEOPLE'S ECONOMY" I don't think the people like 5% inflation. KEEP PRINTING!


