Dax Bearish Shark Pattern + Bullish 5-0 Pattern, short then long
I know Rising Wedge is Bearish but it happens to break north and now the possibility of a nice short on Nasdaq if the pattern complete, lets see
This is my Nasdaq analysis for one to two weeks on a multiple time frame, to cut the C, we are inside of a bullish flag clearer on a 1d timeframe, also respecting all trendlines on 1d to 1h TF, you can trade within the flag while still wide and also trade on a break thru with a great possibility of a reward if you need any help about an entry or anything else...
Break this trend line and the bulls have it
Nice bearish bat harmonic inside of a pennant flag, please trade wisely and at your own risk, any question I will be pleased to answer... which you success 😉👌
A long-awaited correction is on its way, a nice Head and Shoulder is formed perfectly on 1Day time frame chart, also as confirmation the is a bearish flag which has been broken, my plan is to open 3 shorts position with stop loss at 15285 only to the TP1 which will be a large lot or you can choose 15313, TP1 will be on the 61.8% Fibonacci 14976.14 then TP2 14848...
Now let's say, more downward pressure is conceivable. The market was overheated now we are inside a falling wedge (Bullish) and targets are to be met in accordance with the rules, Good luck guys
Bearish Rising Wedge followed by a bullish Shark Harmonic Pattern
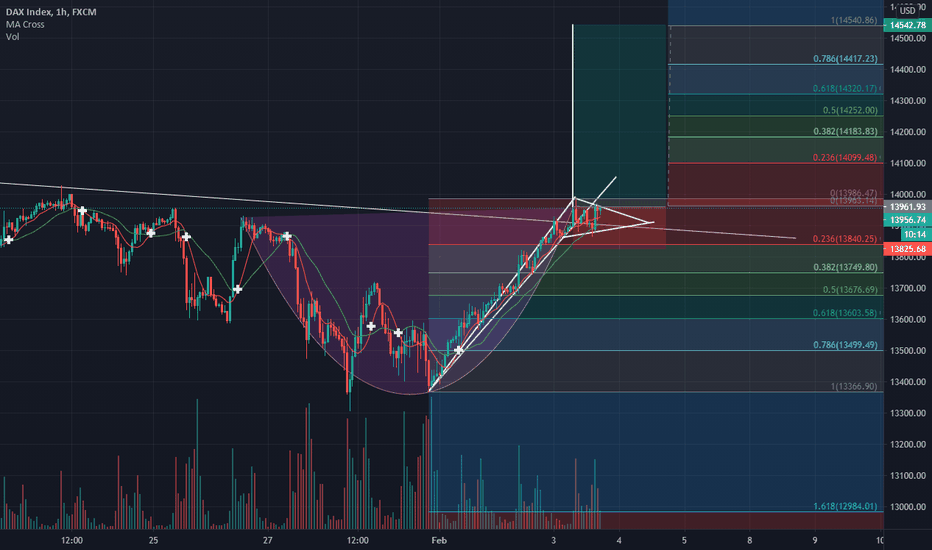
Possible Cup & Handle pattern? would you say that would be the case? I am not very familiar, and this seems to be a giant one, could someone clarify? Thank you FX:GER30
Nearly there, I am going out now, but I will leave the order with SL of course, the fib is in case you want two TP at Fib levels, entry point 15273 GL guys and be responsible GL
Nasdaq has formed an inverted H&S with an opportunity for all-time highs, as you can see on the graphic its all set with entry point, stop loss, taking profit 1 and 2, TP1 is based on the 61.8% Fibonacci as you can see, this is my trade setup, trade at you own risk. GL
I've been expecting this fall since 2 months ago and my target is just above 50, there are still very strong support at 59.24, following the bearish Bat harmonica I expect the price goes back up to 64.04 then fall forming an H&S heading around my mentioned target which I calculated following pre-covid data FX:USOIL
DAX H&S possible setup, lets see it, I like head & Shoulders patterns as they give me so far an 80% rate of accuracy GL
A very High potential, and fits perfectly on my channel I made before broke upwards
formation of the cup and handle, just waiting to complete the formation and the handle break to give exact entry point, if it forms as expect it can be very rewarding - by tomorrow morning I expect the confirmation, GL
trading levels to work with your strategy hope it helps to figure out some areas of support and resistance as well as entry points, I saved that as a point of observations where depending on S&R pressure to take better decision on points of entry, can be very helpful if you know how to use GL guys have a great Saturday
Failure to break the 61.8% will result in a break in the trend line bringing the gold down to test the MA 200 around 1833, provided it breaks the MA 20/100 just waving after the trend line, a great point for a short... GL
On my guess, any break to the triangle downward 45.57 is my guess, on the other hand, a break upwards will be limited about to the 48.16, fib nearing the upside trend line, Good luck everyone


