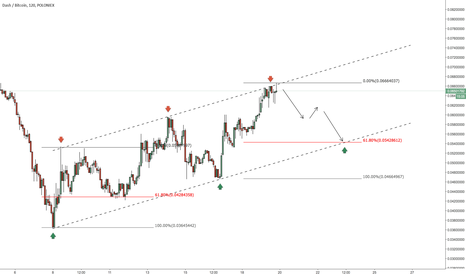
Still moving in a rising channel. Wait for breakout descending line before taking long positions
Bitcoin moving sideways and now re testing previous support line which became resistance as you can see on this clear chart. If current support would be broken, next support will be 7000$ area.
Seems like we touched the dip and correction is over. In my opinion this is a great discount for now. Look at trend lines and make your decision.
Possible Cup & Handle formation. Best way to enter this pattern when handle will be formed
We have: Bullish pennant or falling wedge. Broken structure of descending trend line. Rsi confirmation. Fib levels. We need to see confirmation, such as bull candle to enter the trade. PS: Don't need to put much shit on the charts. Perfect is Simple :) Let's fly!
We have: 1. Bullish pennant. 2. Broken ascending trend line. 3. Rsi confirmation. 4. Fib levels.
Gold making clear ABCD pattern. Waiting for break out before look for sell setup. D should be a point of price destination. Then we can look for price to reversal and by setups.
Price made falling wedge pattern. MA and RSI looking bullish. Looking for some engulfing candle to enter the trade. First stop is around 1.618 FL
BCHUSDT made symmetrical triangle. Price broke descending resistance line and retest it as new support. Rsi gives confirmation. Open your pockets and look for a nice break out.
Hey Guys! Bitcoin began to move in ascending channel since early 2107. Now top of this channel was broken and already retesting. Resistance become support. As we can see on a daily chart correction remains between 61.8 - 38.2 most of the time Now there are two clear possibilities. If upside line will keep the price one of the opportunities is 161.8 Fibs, with...
Gold touch weekly resistance 1269 / 0.382 Fibs and pullback to retest previous support zone 1278, near 0.236 area. Feels like it would be nice place to start new rally to previous highs and higher. Also, Gold still trading in a bull channel since Dec 2016


