Riven-Corp
higher high on the daily chart. Head and shoulder on the h4 chart. Broke 200 ema on the hourly chart.
Trade at your own risk.
As you can see i lined up all the possible resistance and support for you. Currently GBP is weak
Doesn't look like it's going down. You know how it is = Resistance became support.
Pretty simple, it might goes up or it might not, I might be wrong. Invest at ur own risk :)
Base from price reversal candle it could potentially be bullsih
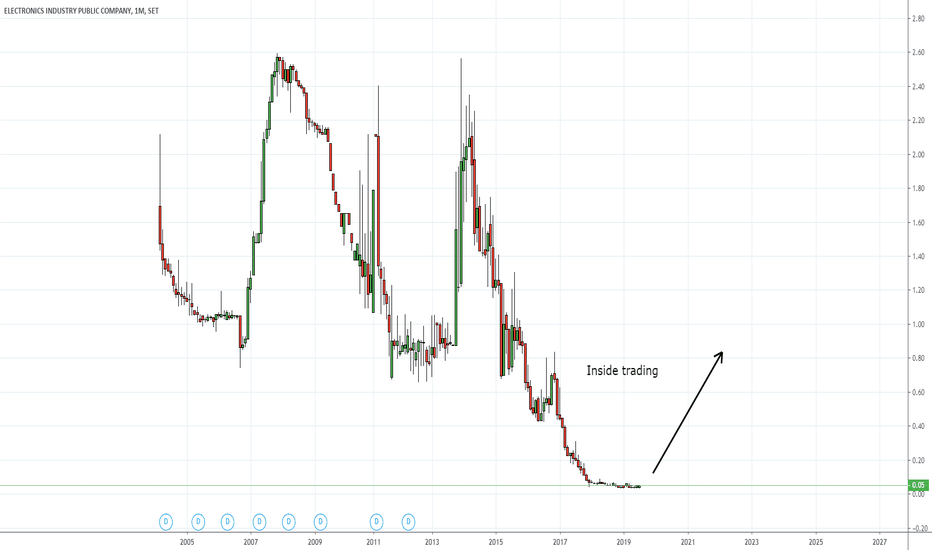
Potential breakout in the future but for now I think its a sell.
From many duration of support it turn to be resistance. Signs of reversal and huge potential sell.
See it for yourself, It's a buy to me. All comments are appreciated.
See it for your self, comment and give reason if you disagree. Thank you
I think this is what is going to happen as it did broke out but my predictions are still right. Lets take a good look on price action as it continue to be a down trend.
All comments are accept, please leave your ideas in the comments. Keep a good eye on this!


