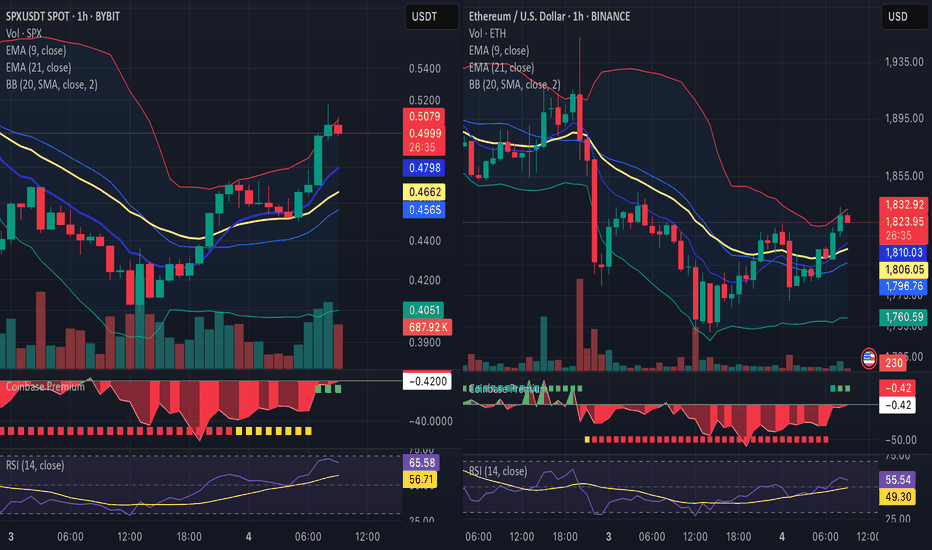
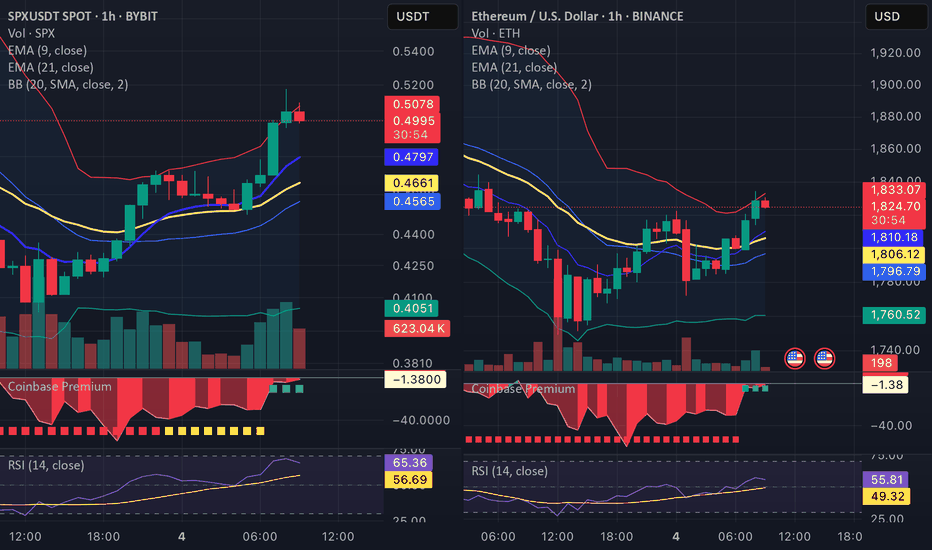
Let’s take a closer look at Ethereum (ETH) – not just following SPX, but showing some of its own behavior lately. 1. Structure & Indicators - ETH is currently retesting the 200 EMA zone on the 1h chart, and candles are starting to flatten near resistance (around 1833–1835). - RSI is at 56–57 and losing momentum, approaching overbought on low volume. ...
Hey everyone, just sharing my thoughts on the current market situation based on recent developments and upcoming events. 1. Tariff Announcement Shockwave Yesterday's announcement from former President Trump regarding significant import tariffs has already triggered strong market reactions. We saw a sharp drop in SPX and related assets , with nearly 30%...
- EMA 9/21: Clearly broken above and now being tested as support - Bollinger Bands: Price touched the upper band — possible overbought condition - Coinbase Premium: +15.56 — rare! Indicates real spot demand - RSI: 66.12 — approaching overbought territory, suggesting momentum is weakening, but not yet at an extreme level ✅ Positives: - The price rally is...
Dangerous market situations. Lots of false growth. Don't enter positions now, wait until they sell out completely.


