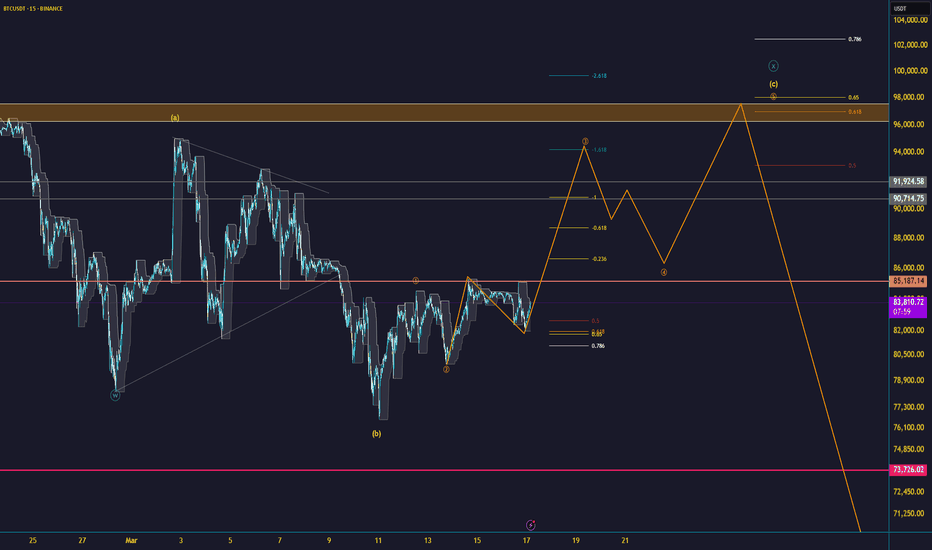
If BTC manages to do a lil relief rally and reaches ~96k I would definately be locked and loaded for the last leg down
Shall we see BTC tear down all walls? We see the 90s sweep of liquidity where the MM and hopefully a lot of you filled the bags. Now 108k high has been swept. Lets see where the current correction takes us.
medium.com Based on the premise that the entire market has been extremely bullish for the past ~420days, I do expect for the market to maintain its bullish momentum. We have approximately 103 days until the Bitcoin halving occurs (The next Bitcoin halving is expected to take place in April 2024. It is difficult to predict the exact date as it depends on the...
After every 210,000 blocks mined, or roughly every four years, the block reward given to Bitcoin miners for processing transactions is cut in half. In the past, these Bitcoin halvings have correlated with massive surges in bitcoin’s price. The first halving, which occurred on Nov. 28, 2012, caused an increase from $12 to $1,207 by Nov. 28, 2013. The second...
The Bitcoin conundrum An article I wrote back in 30Oct22, below. Posting the live chart medium.com
or s1 to copy the chart Ever since Nov21 the tide has turned and the trend maintains its bearish momentum printing LH-LL across all TFs. After the 1st impulse to 33k , price was hovering around the 39k Macro OB for 3 months which lead to further expansion toward the 30k support level which was short lived and followed by a sharp drop to yet another key level –...
1) After a month of ranging behavior, Bitcoin breaks a key support level (7700ish), and with all the long liquidity lying underneath, price essentially prints a green dildo stop hunting the bullz that flipped bearish below 7.7. 2) Price fails to close above prior Major support that naturally acts as resistance (on the way up) Conclusion #1 that leads to a...
After a successful bearish SFP on the 6h, at a liq zone which lies at the top of the range, price logically finds support and continues to hover over the trend line with no Meso/Daily close below it. Initially price found support at 8255 ,and afterwards it retested the 8473 lvl, which acted as resistance on the way up, but after the impulsive move...
Watching closely the 8985 lvl (weekly open) on BFX. Mid week and we are already seeing nice reaction of this level. Any daily/meso close *below* this line would indicate underlying weakness If BTC manages to hold the weekly open ofc the 10k range is a relevant target that aligns with some other stuff, as seen on the chart Trade safely! Robo Out


