Rotuma
PremiumThe Volatility Index (VIX), commonly known as the market's "fear gauge," has reached a critical juncture, testing the pivotal 2-year support/resistance level at 18.80. Following a dramatic 40% decline from its recent high of 29.20 to 17.32, the VIX has established a symmetrical triangle pattern, indicative of an imminent breakout. Major U.S. indices, including...
The US 10-Year Treasury Yield, which dropped as low as 4.16% in February, has staged a modest recovery after finding technical support at that level—a move highlighted in our March 3 analysis. However, yields now face a significant hurdle: a 5-month major resistance zone, sitting just below 4.40%. This area has historically acted as a pivot for medium-term...
The greenback ends Q1 under pressure as soft inflation data, central bank divergence, and rising risk appetite weigh on the long-term outlook. 📉 A Fragile Finish to Q1 for the Dollar As we close out March and head into Q2, the US Dollar Index (DXY) is on track for its worst monthly performance since December 2023, erasing nearly half of its four-month rally. From...
🧭 After a brutal 55% sell-off, Tesla bounces sharply—but reputational damage, six-quarter earnings misses, and resistance at $284 may limit the upside. 📌 Tesla Bounces After 55% Decline, But Can It Last? Tesla shares have staged an impressive 17% rebound over the past two sessions, closing near $282 after briefly dipping below long-term support at $221—a level...
Fundamental and Technical Signals Suggest Potential for Deeper Corrections NVIDIA Corporation (NVDA) is under significant pressure, mirroring the broader bearish sentiment gripping global equity markets. The semiconductor giant's shares have suffered a substantial 23% decline from their January peak at $153.13, illustrating vulnerability amid macroeconomic...
The Dow Jones Industrial Average (DJI) closed at 41985 on Friday, up 0.08%, maintaining its position above critical support at 41330. The index has dropped more than 6% since the start of the pullback from highs of 45073 in January 2025. The long-term bullish price structure that has lasted over two years remains intact; however, a double-top formation at recent...
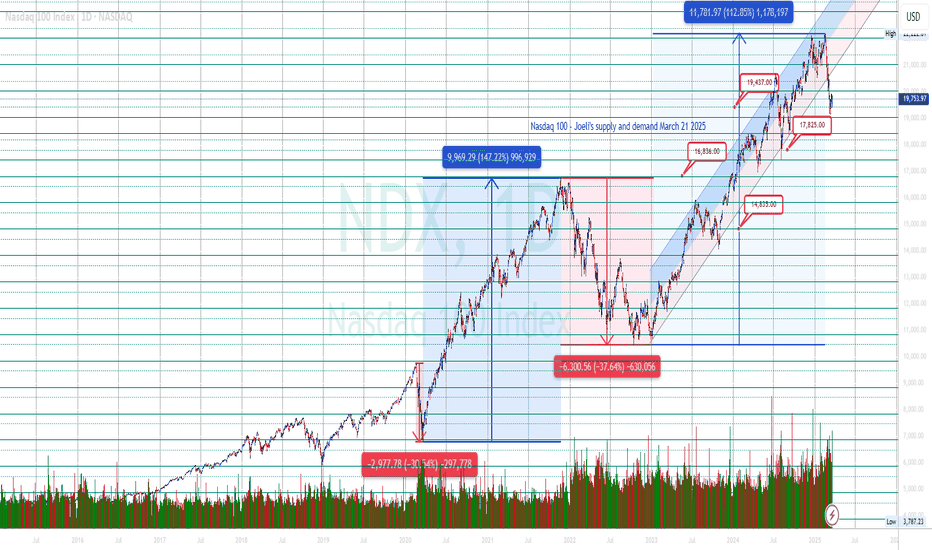
The Nasdaq 100 has plummeted over 11% from its record high of 22,222. With prices now testing key support at 19,437, the index closed slightly higher at 19,753 (+0.39%) on Friday. However, weakness remains evident, indicating the first stage of a potential major correction. Historically, corrections unfold in four stages as part of a healthy market reset. If...
S&P 500 increased by just 0.08% to close Friday's trade at 5,667 after a four-week decline. It is now down over 7% from February's peak of 6,147. The index has broken its bullish daily structure, signalling the start of a major correction. Critical support at 5,542 must hold to avoid further downside. If support holds, a temporary rebound could reach targets of...
Microsoft (MSFT) faces a challenging outlook after a 16% drop from its July 2024 peak. The long-term bullish structure has broken, with critical support at 380.65 providing temporary relief. Short-term recovery targets include 395.20, 404.40, 418.70, and 427.70. A significant market pullback could drive shares toward 357-348, 333.50-324.50, or even 310.00-300.00,...
Apple (AAPL) has fallen 16% from its all-time high (260.10), testing significant monthly support at 232.50 and 219.86. With a Friday close above 214.96, temporary rebounds to 219.86, 224.40, 229.35, and 232.50 are possible. However, a broader market pullback could send Apple lower to 207, 200, 186, or even 178.
With its long-term bullish structure compromised, Alphabet could repeat its previous 45% correction. Although closing at 163.99, slightly above the critical 156-160 support zone, any rebound might be capped at 167.35, 174.00, 185.58, and 192.70. A break below support could see shares fall toward 144-137 or even 126-119, marking a 42% correction
SPX broke through the 4040 critical resistance line in Thursday's trades but will be challenged at 4082.50, an area of resistance in the past, as highlighted in the attached price chart. 4040 is now a major support which could be tested if it fails to breakout at 4082.50.
What do BTC/USD and Nasdaq Composite price charts have in common? A bear flag. The current price structure in the four-hour time frame points to further moves to the downside if BTC fails to hold above 17894. BTC/USD could head back down to 16000 and 15696 if it falls and remain below 16430
Would you consider buying TSLA at 85? or do you see the price falling further down? 85 is a critical level based on the current price cycle. Not financial advice; the analysis is based on my technical indicator for educational purposes only. You can follow my work for future updates and short to long-term forecasts on the stock market as we navigate through...
The rising wedge price pattern marked on the price chart is a technical indicator of a potential pullback that could occur in the near future. Bank Nifty's solid uptrend will be tested at the 41620 critical trading zone parallel to previous trading activities in October 2021, September 2022, and November 2022. Buyers must rigorously defend the 41620 zone to avoid...
The nifty 50 Index fell three consecutive sessions, falling below the 18342 support line around the rising wedge and 18036 critical support zone in Friday's session, as indicated in the price chart. 18036 crucial area is a level to watch, as demonstrated in the past, where it served as support and resistance since October 2021. Bulls will need to reclaim 18036 to...


