btc
elliottwaves
eth
ethusd
fibonacci
iota
iotausd
iotusd
mtfa
neo
neousd
oscillator
short
supportandresistance
trendanalysis
waveanalysis
wedgepattern
Less Tags
Show All Tags
All Types
Type
All Types
Indicators
Strategies
Libraries
All Accesses
Script access
All Accesses
Open
Protected
Invite-only
Public & Private
Privacy
Public & Private
Public
Private
candlestick
dm_indicator
sequential
tdsequential
tdsetup
thomas_demark
Less Tags
Show All Tags
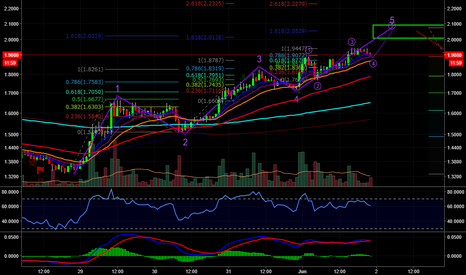
I had a thought that the fifth wave was over. However, in some time frames (30m, 45m, 1H, 2H), the Histogram seems to have one more upward momentum and the RSI in 4H don't have a divergence. White line is a resistance from september 4 and Nov 7
2
That looks like an ending diagonal to me.
4
New count, same pricetargets
2
The previous count is invalidated. This is an alternate count with new targets.
6
Wave 3 is shorter than 1, wave 5 must be shorter than 3. It's an 1,2,3 or A,B,C ??? Most likely A,B,C
3
5 sub-waves aim to a target from 2 .00 to 2.10
3
2
0
0
Message
Follow
Following
Unfollow
10
29
134
Message
Follow
Following
Unfollow
2
0
0
Message
Follow
Following
Unfollow
15589
569
14235
Message
Follow
Following
Unfollow
2833
438
7402
Message
Follow
Following
Unfollow
422931
421
67336
Message
Follow
Following
Unfollow
Type
Script access
Privacy


