We have broken below a key parallel structure, similar to Feb 15. Currently, we are consolidating within the small parallel channel I've drawn. Either this structure is a consolidation pattern, or a bear flag, depending on the way you draw it. I stay bullish on UNI in the long term - ESPECIALLY if we enter a alt-cycle where you have to use UNISWAP to get...
Stop Loss at 0.00051 T1 at 0.00062 level If we break above the parallel channel, and confirm it, I would just suggest to hold on to your remaining AVAX assets and enjoy the ride. The team is magnificent and the coin is undervalued at the moment given its potential in my opinion. You could also stake it on AVAX's native wallet, around 10% APY. Keep learning.
We have broken outside of the Orange Parallel Channel. We have confirmed the breakout Now we should see a move to the upside by a minimum of the size of Parallel Channel (which corresponds to 8% upside from here) Target and stop loss is indicated on the graph. Cheers!
I think the charts speak for themselves. We will potentially be seeing a repeat of the previous run to the top parallel channel. Stop Loss at 675 level. Take profit at 1200 level. Let's see how this plays out.
Every option date which is 26th of that month, seems a bottom for next wave. April is historically a good month for rise We can visit 21 WW MA in last week of April Logarithmic Growth Curve will be at 70K ish level Invalidation of BULL Flag, can lead BTC Price to 44K Level, worst scenario is 40 ish level wher 21 W MA will come %85 Probality to go up 67-75 Kusd...
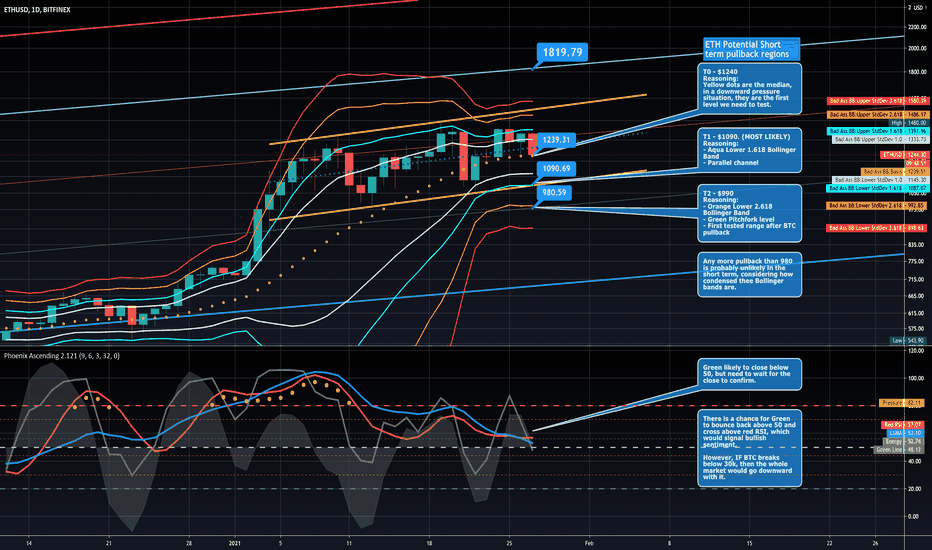
I am not saying that the price MUST go down. This is just a worst case analysis IF BTC breaks below 30K. As the Bollinger Bands are quite contracted, and the red RSI has not fallen below 50 yet, we might not reach orange bollinger band level but certainly touching aqua Bollinger band and the bottom parallel channel is likely. Our base target was 1260 - which is...
There is bearish signal in short term (2-3 Weeks), and still so strong bullish in long term (end of 2021) BTC Deposit to Exchanges is also strong bearish signal that needs to be followed. Possible targets a) 30.200USDT @Binance Target Point break down of head shoulder formation in navy box b) 27.600 USDT @Binance level blue Head shoulder – Most likely hood...
34K Level was the upper limit of one of the BTC logarithmic rainbow channels. BTC is historically overbought. 14W RSI over 90 and BTC (compared to 2017 levels) is significantly higher than its 20W SMA . The MA Overextension indicator emphasizes this fact. BTC Dominance needs to bleed, for this to happen either: 1) BTC will go sideways, money flow into ALT's 2)...
SAN sets a good base, and will keep continue its uptrend
GVTBTC sets herself to go up to 0.0040 level...
Good level of support with a good volume profile. Target is to reach upper trend 0.00024 Level or higher
Inverse Head Shoulder is formed and ready to break out to 395 - 390 level


