SINGNALS_PROVIDER
Gold (XAU/USD) 4H Chart Analysis: Trend: Uptrend inside an ascending channel. Current Price: Near resistance at the top of the channel. Possible Move: If price rejects resistance, it may drop toward the lower trendline. Trade Idea: Sell if rejection happens at resistance. Target: Lower boundary of the channel. Stop-loss: Above recent highs. If price...
The chart suggests a possible sell opportunity if gold breaks below the trendline. Sell Confirmation: A break and close below the trendline. TP1 (~$3,000): First target. TP2 (~$2,975): Second target. Invalidation: If the price stays above the trendline, the uptrend may continue. Watch for a confirmed breakout before taking a trade.
This chart represents a 4-hour timeframe of Gold (XAU/USD) CFDs with key technical elements indicating a potential bearish move. Here’s a breakdown of the analysis: Key Observations: 1. Uptrend Structure: The price has been in an upward trend, forming higher highs and higher lows. A steep ascending trendline (blue) suggests strong momentum but could indicate...
This is a 4-hour chart of GBP/USD showing a technical analysis setup. Here’s a breakdown of the key elements: 1. Current Price & Trend: GBP/USD is trading around 1.29291. The price action suggests an uptrend, but there are signs of potential weakness or reversal. 2. Support & Resistance Zones: Resistance Zone: The green box around 1.3000 suggests a...
Gold (XAU/USD) 4H Chart Analysis 1. Trend Overview The chart shows gold (XAU/USD) on a 4-hour timeframe. The price is currently at $2,984.020. There is a strong uptrend forming, as seen in the recent price movement and the breakout from the previous resistance zone. 2. Key Levels Support Levels: Around $2,950 - $2,960 (previous resistance turned...
This is a 4-hour Bitcoin (BTC/USD) chart from Bitstamp, showing technical analysis with key levels, patterns, and projections. Here’s the analysis: 1. Chart Overview Current Price: $83,046 Price Change: -1.54% (-$1,301) Resistance Level: White horizontal line (~$84,000) Support Zone: Lower red box (~$77,000) 2. Pattern Analysis The yellow zigzag lines...
This chart represents the Ethereum (ETH/USD) price action on the 4-hour timeframe. Here’s a breakdown of the analysis: Technical Analysis: 1. Descending Channel Breakout: The price has been in a falling wedge or descending channel, visible with the downward-sloping trendlines. The recent breakout above the upper boundary of the wedge suggests a possible trend...
Bitcoin (BTC) is trading at $84,212, moving inside an ascending channel. Resistance: Around $85,000 Support: Around $82,500 Breakout Up: Could push towards $87,500 - $90,000 Rejection Down: Might drop to $82,500 - $80,000 Watch for a breakout or rejection at the resistance zone.
The chart shows a breakout from a downtrend, indicating a possible bullish move. The price has broken above a trendline and is now forming higher lows. The blue box suggests a target area around $72, while the red box marks the stop-loss zone below $66. Green arrows indicate expected upward movement. If the price holds above support, it could continue rising.
Support: Around $80,000 (price bounced before). Target: $84,000 - $85,000 (next resistance). Trade Idea: If price stays above $80,000, it may go up. Stop-Loss: Below $78,900 for safety. Trend: Possible uptrend if support holds.
The chart shows a bullish breakout from an inverse head and shoulders pattern. Price is in an uptrend and may continue rising towards $3,023. If it retests the breakout zone and holds, the uptrend is strong. If it falls below the neckline, it could be a false breakout.
The chart shows a breakout from a downtrend (blue channel). Bitcoin is facing resistance around 84,000 - 85,000, marked in red. If it breaks above, it may continue rising. Otherwise, it could drop back to 80,000 support (blue box). Watch for confirmation before trading.
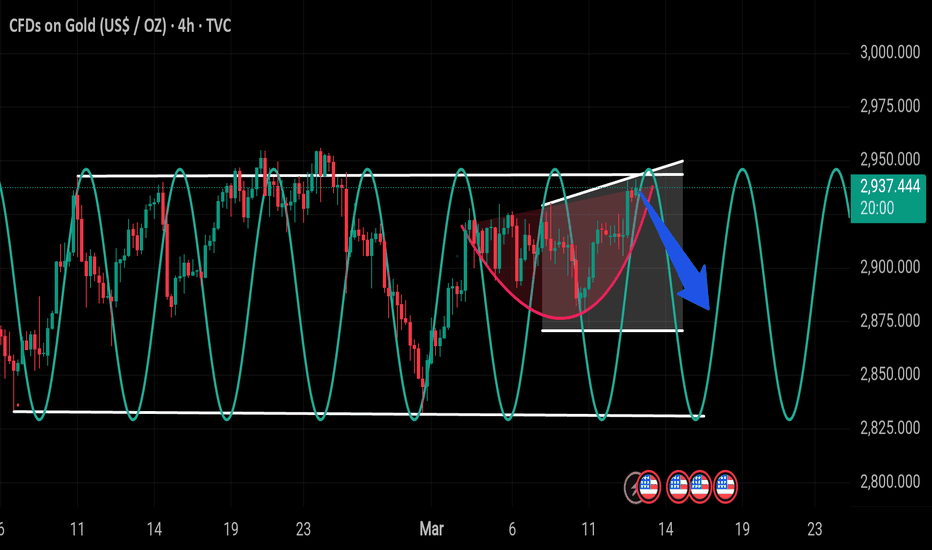
Gold (XAU/USD) on the 4H chart is forming a rising wedge, which is a bearish pattern. The price is near resistance at $2,960, and support is around $2,900. The blue arrow suggests a potential drop, meaning if gold breaks below $2,900, it could fall to $2,850 - $2,820. If it breaks above $2,960, it may continue higher. Watch for confirmation before entering a trade.
The chart shows a bullish Inverse Head & Shoulders pattern. Price has broken above resistance and is retesting before a potential move higher. The target is around $2,960-$2,980, with support near $2,900. If the breakout holds, gold could continue rising.
The chart shows that gold was in a downtrend but has now broken out of the descending channel. This breakout suggests a potential upward move. If the price holds above the breakout level, it could continue rising toward the next resistance around $2,925 - $2,950.
The gold price is in an uptrend but recently pulled back to a key support level near $2,900. If this support holds, we could see a bounce towards $2,940 - $2,960. A break below could lead to further downside towards $2,880. Watch for a bullish reversal or a breakdown before making a trade.
Bitcoin is currently trading at $96,644 on the 4-hour chart. Support: Around $94,000 - $95,000 Resistance: Around $98,000 - $102,000 Possible Move: Price may drop to the support zone before bouncing up towards $100,000+, or break below for further downside. Overall, watch the $95,000 level—if it holds, Bitcoin could rally upwards.
Gold is in an uptrend, moving within a rising channel. If it breaks above resistance around 2,937, it may continue higher toward 2,975–3,000. A rejection could lead to a pullback. Volume supports the bullish momentum.


