STERLINGREGENT
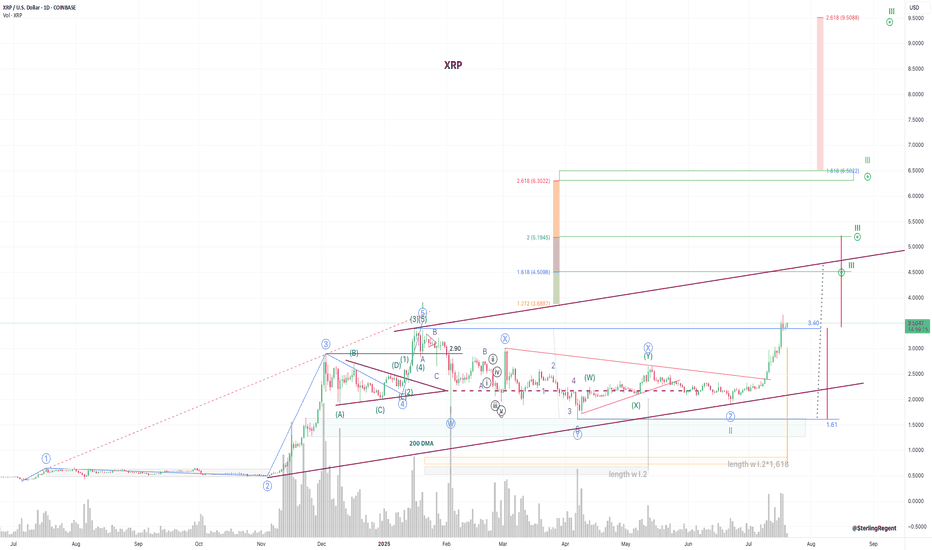
PremiumTrying to figure out targets for XRP's current wave.
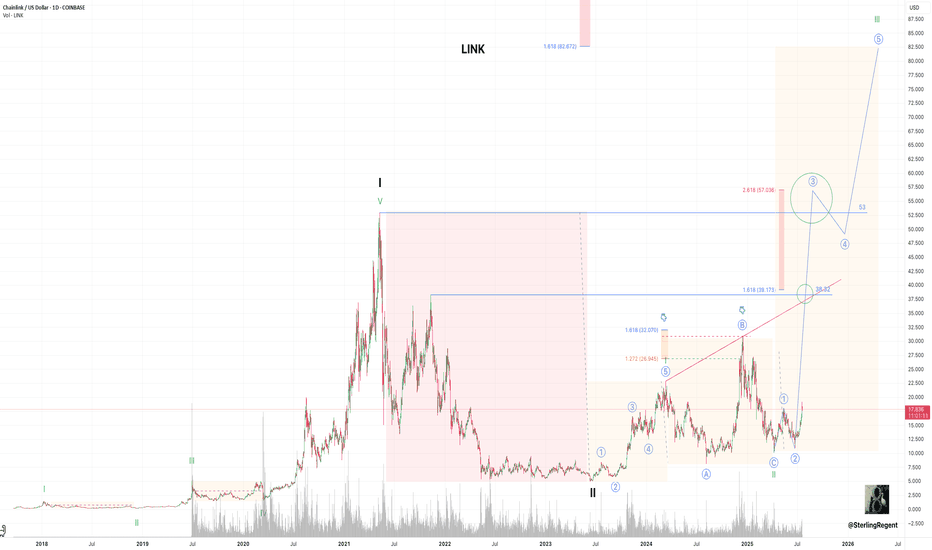
LINK may be finding itself in the beginning of a major proverbial wave III.
It is underway, and Eth\Btc looks promising, especially with this pennant like structure.
In my view, ONDO is about to start it's even more stronger ascent. Re waves - it's my position that it is an expanding consolidation in the first period of coins existence and I am marking it as abcde, with likely f g h i to follow as in symmetrical pattern (symmetry in time and proportionality in structure can't be denied). But you can treat as some kind of...
That's my view on Bitcoin's pa for the time being.
Let's check about this flag and double bottom in BA. One needs to take risks on such flags - what can be better than this, though execution is always tricky.
This superimposition of Cup and Handle and Ascending triangle pattern creates a positive setup in KO.
Ripple. This assumed wave II green may still under way as nothing impulsive of the blue degree has yet formed to convince that wave III.1 green (or 1st blue in the IIId) is underway. XRP possibly (optimistically) can continue going up now (will take a lot to explain), to that upper brown line (imo, channeling techniques), but not to the red one. Timing...
Current wave can go up quite far in the main Forex pair.
DXH25. There signs of weakness, but this support zone from 106.5 can consolidate pa and stop the US dollar descent. Measured move is a suggestion, in case it gets through.
A wide range action is persisting ing ETH. Ok, the swing up is in making, but it's hard to get the idea of shape. Possibly it should be filling the volume shortage between current levels and 3100.
TSLA stock is promising but not just yet.
A bit expanding range in BTC from 22 Nov.
Need to watch for the breakout from the handle. BTC.
One last piece remaining in GS before a meaningful correction. That the max extension in time shown.
Calm and uneventful end of BTC major cycle.
The coefficient displays multiple reversal factors from lower green technical line supporting (appr) at current levels to possible LTF and HTF reversal chart patterns in different stages of formation, though which can morph into smth else with time. Cyan lines, like cycle but of course not with this kind of scarcity, also may hint on timing, that a reversal may...


