XAUUSD breakout falling channle and resistance zone. Buy above 3295 Stop Loss: 3291 1st TP: 3308 2nd TP: 3313 3rd TP: 3322 4th TP: 3333
Trendline Breakout: Price has decisively broken above a short-term descending trendline, signaling a potential shift in intraday momentum from bearish to bullish. Support Zone (1.3185 – 1.3195): This demand area has provided a strong base, with multiple successful rejections confirming buyer interest. Resistance Levels: Near-term resistance: 1.3213...
EUR/USD is currently trading within a Descending Triangle formation. At present, the pair shows a higher probability of an upside breakout from this structure. A confirmed break above the immediate resistance zone at 1.1428 – 1.1430 could accelerate bullish momentum, opening the way toward the next key resistance level at 1.1485. On the other hand, if the pair...
Gold is currently consolidating inside a triangle pattern. After a recent bullish rally, price retraced between the 61.8% – 76.4% Fibonacci levels, finding support and bouncing upward. At present, gold is facing resistance at both the falling trendline and the 3298–3300 zone. Bullish Scenario: A breakout above the resistance trendline and the 3298–3300 zone...
Bearish Wedge Breakdown: The price was consolidating in a descending triangle / wedge pattern. It has now broken below the wedge, suggesting potential bearish continuation. Key Support Zones: Immediate support near 68.60 - 68.80 (highlighted in blue). FOREXCOM:USOIL The break of the 68.60 level with a strong bearish candle would serve as ...
Currently, Silver is trading inside a symmetrical triangle formation , signaling a potential breakout. Upside Scenario: A breakout above 36.80 resistance may trigger strong bullish momentum. The next target zone lies at 37.18 – 37.30, which is a relatively weak resistance and could potentially form a Head and Shoulders pattern . If momentum continues,...
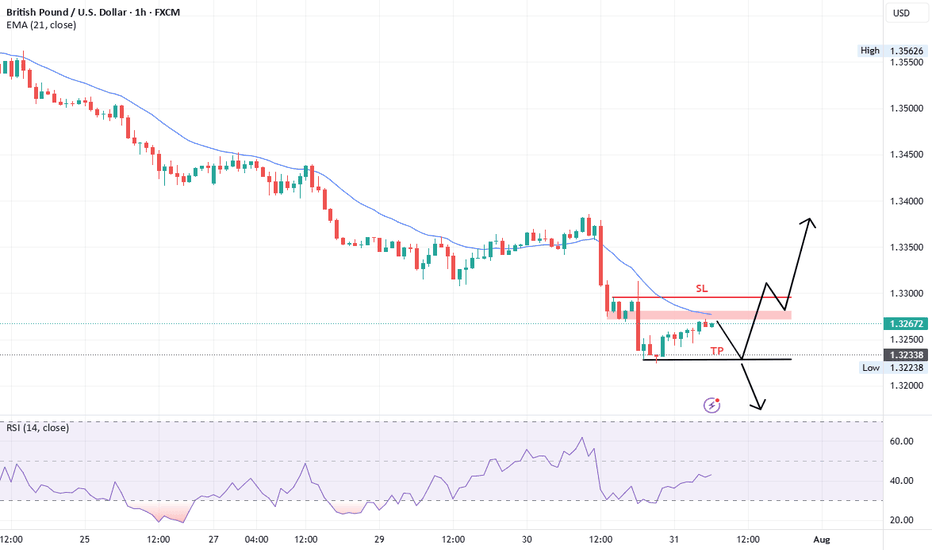
FOMC Press Conference and USA Fund rate same Sell 1.3270 Stop Loss 1.3295 TP 1.3235
Sell below 3302-3304 Stop Loss 3309 Targets 3288 3275 3268 3255
US30 recently bullish rally complete now time to start retrace 50% and 61.8% at least touch, after this retrace then new bullish move start. Reason for sell evening star. Sell Current price Stop loss 35790 target 50% and 61.8%.
Daily chart this week break bullish wedge with 61.8% retrace level touch. Weekly chart
XAUUSD right now emerging continuation patterns. Gold buy 1954 Stop loss 1948 target 1975 and 1983.
USDJPY break following trendline now retest support level 130.60 Buy 131.20 Stop loss 127.30 Targets 134.60, 137.90 and 142.00....
XAUUSD Daily timeframe trend line break and double top formation complete, Now wait for new sell entry near 1887-1896 with stop loss 1925 target 1830 and 1805. Weekly chart evening star
XAUUSD sell 1658.80 again sell 1662 Target 1650, 1645 and 1642....
EURUSD double top pattern complete and now retest nick line. Strong sell 0.9750 Target 0.9680, 0.9600 and 0.9500....
GBPUSD The market is test the resistance 1.1360 and it created H1 chart pattern double top and divergence MACD and RSI . H4 Fib Retracement 76.40% . I expecting GBPUSD down side move start. Right now support 112.00 and 111.66. Resistance levels 113.80 & 114.70. 15M chart break support and retest structure now again down side move start. Now next support rising...
XAUUSD Sell 1667.50 Stop loss 1672.50 Target 1660.00 and 1654.... trend line and retest with 5M chart evening star and 50EMA touch.
WTI Crude Oil The market right now trade range bond area. If market break 90 then market upside, market break 88.00 then market further down side and new buy zone 86.40-85.90... H4 Daily


