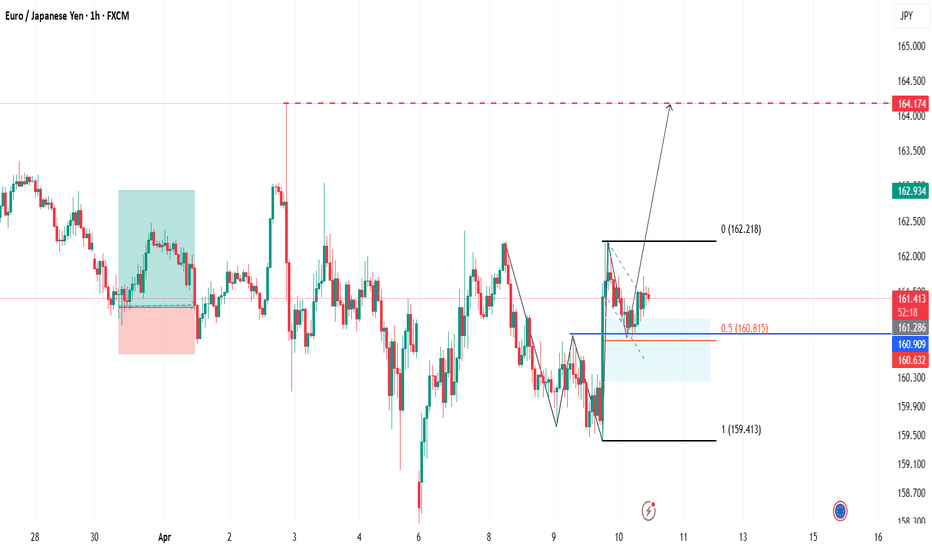
Good Morning Traders, Trust you are good. Below is my analysis of the EURJPY pair. Overview Price is currently at 161.243, showing signs of a bullish rebound following a sharp drop. A clear bullish structure is forming, characterized by higher lows and a breakout from a recent consolidation zone. The demand zone between 160.900 and 161.100 has held strong,...
Good day Traders, Take a moment to go through my outlook of DXY. Currently, DXY is moving within a clearly defined ascending channel, showing a short-term bullish correction after the sharp drop seen last week. Price is respecting the channel's boundaries, making higher highs and higher lows, characteristic of a pullback phase in a broader bearish...
Good morning Traders, Trust you are well. Below is my analysis of the current price action on EURUSD amidst the trade war. Overview EUR/USD is trading within a descending channel, showing signs of a potential bullish breakout. Price recently rejected the 1.08115 support zone with a strong wick, suggesting buyer interest. Globally, trade tensions are...
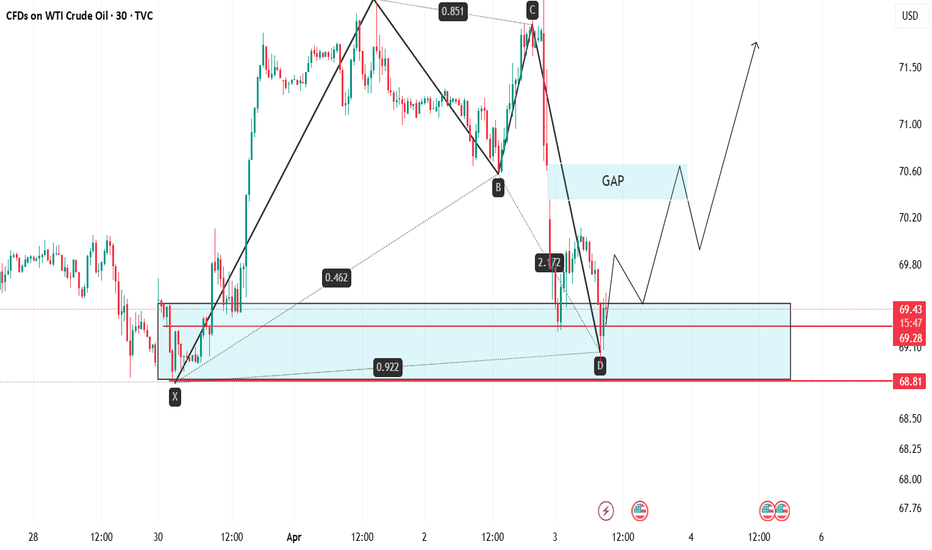
Good morning Traders, Trust you are doing great. Kindly go through my analysis of USOIL. USOIL is currently experiencing market imbalance due to the nature of its opening range, following a gap-down decline last night in response to trade war concerns that have fueled recession fears. The price dropped from its weekly high of 72.22 to a key support zone at...
Hello Traders, I trust you're doing well. It’s been a while! Since March 18th, the EUR has been in a corrective pullback, and I anticipate further downside movement to complete Wave 4 of the correction. However, this afternoon, we witnessed an unexpected surge in the EUR pairs, driven by the EU’s emergency plan to shield its economy from U.S. tariffs. Despite...
Good morning traders and Happy New Year. This is my first 2025 trade: USDJPY Sell. Analysis or commentary will come later. Cheers and Happy trading.
Good day traders, Trust we all profited from the FOMC report of yesterday. Please take a moment to go through my outlook and expectation on Euro in the coming weeks into the new year. Overview EUR/USD appears to be rebounding after a sharp decline triggered by yesterday's FOMC report, where the FED delivered a hawkish 25bps cut, which drove higher...
Hello Traders, Trust you are doing great. Please take some moment to go through my analysis of USOIL and share your thoughts. Overview USOIL is currently trading at 70.08, with mixed trends across timeframes. On the H4 chart, the pair remains bullish, recovering from a recent correction. Meanwhile, the H1 chart shows a bearish trend in a corrective phase,...
Good morning traders, Trust your day is off to a great start. Take a moment to read my analysis of the Gold market, and give your view. Overview Gold is currently trading at $2,662.25, caught between a bullish and bearish triangle range. This follows an impulsive upward movement from Friday’s low of $2,612.89, driven by the Non-Farm Payroll (NFP) data....
Hello Traders, Trust you had a great weekend. Take a moment to read my analysis of the NZDUSD currency pair. Overview The NZD/USD pair is currently trading at 0.58325, maintaining a clear downtrend on both the H1 and H4 timeframes. The pair remains confined within a bearish channel, reflecting continued selling pressure. Idea The price is currently...
Hello Traders, Take a moment to read my outlook on USDCAD, and share your thoughts Overview USDCAD is currently trading at 1.40623, showing bullish trends on both the H4 and H1 timeframes. However, the bullish momentum on the H4 appears to be weakening, suggesting the uptrend may be nearing a potential reversal zone. Market sentiment remains bullish, supported...
Hello traders, Trust you are doing great. Below is my analysis of EURNZD currency pair. The EURNZD pair, currently trading at 1.78462, is showing potential for a rally due to the convergence of two emerging harmonic patterns: a bearish Cypher and a bearish Butterfly. Both patterns suggest a potential move toward 1.81648, where their D leg projections align. ...
Hello Traders, Trust you are great. Below is my perspective on the probable direction of GBPUSD in the coming days. Overview On the H4 timeframe, GBP/USD remains in a bullish trend. However, on the H1 chart, the pair is consolidating within a bearish structure. Key resistance levels are observed at 1.27219 and 1.27026, with the recent high at 1.27496 marking...
Hello traders, I can see that the NZDCAD pair is currently trading at 0.82634, maintaining a bullish trend as price action consistently forms higher highs and higher lows. After a temporary correction from Friday's high of 0.83107 to 0.82495, the pair appears to have resumed its upward trajectory, targeting a breakout above the previous high. Key Observations...
Hello Traders, Trust trading has been awesome. Find below my analysis of AUDJPY currency pair. Current Price: 99.738 The pair shows bearish sentiment across the H4, H1, and M30 timeframes, with a downward trend firmly established (as price keeps making lower highs and lower lows). Momentum indicators suggest strong bearish pressure; however, the price is...
Good day Traders, Trust you are doing great. Below is my analysis of GBPUSD. Trend & Sentiment GBPUSD, currently trading at 1.26666, shows signs of a potential bullish reversal. After failing to break the recent low at 1.25966, the pair has started forming higher highs and higher lows, signaling a shift in market dynamics. A clear inverted head-and-shoulders...
Hello Traders, Below is my analysis of USDJPY currency pair from H1 perspective. Trend & Sentiment USDJPY is in a strong downtrend, forming lower highs and lows. The recent break below 153.819 confirms bearish momentum, with sellers firmly in control. Key Levels Resistance: 153.962 (Minor), 154.653 (Major) Support: 153.276 Possible Movement Bearish...
Hello Traders, Trust trading has been awesome for you. Please find below my analysis of the EURCAD currency pair from H4 perspective. Trend & Sentiment The pair remains bearish, forming lower highs and lows. Sellers maintain control, though the current consolidation suggests temporary indecision, even though price is facing resistance around the 1.48591. Key...


