ScotianBot
It appears as though Ethereum is getting ready to make a BIG move. Price target of $218.00 USD by the EOM. Time will tell per usual.
It appears as though Dash has broken some key resistance levels. I have a short term price target of $167.00 USD by the end of summer.
It's possible that Aleafia finds support in the first channel below the broken triangle i talked about in my last post, clearly visible on this chart. It's also possible she finds some tough resistance & continues lower. The broader markets are selling off so I'm not sure if Aleafia will be the exception. I'll wait for a better entry point again, but Aleafia...
What is an Ascending Triangle? An ascending triangle is a chart pattern used in technical analysis. It is created by price moves that allow for a horizontal line to be drawn along the swing highs, and a rising trendline to be drawn along the swing lows. The breakout can occur to the upside or downside. Ascending triangles are often called continuation patterns...
I posted a chart several days ago showing TNY resistance levels. Now that a couple days have passed you can see the Ascending triangle. Cheers
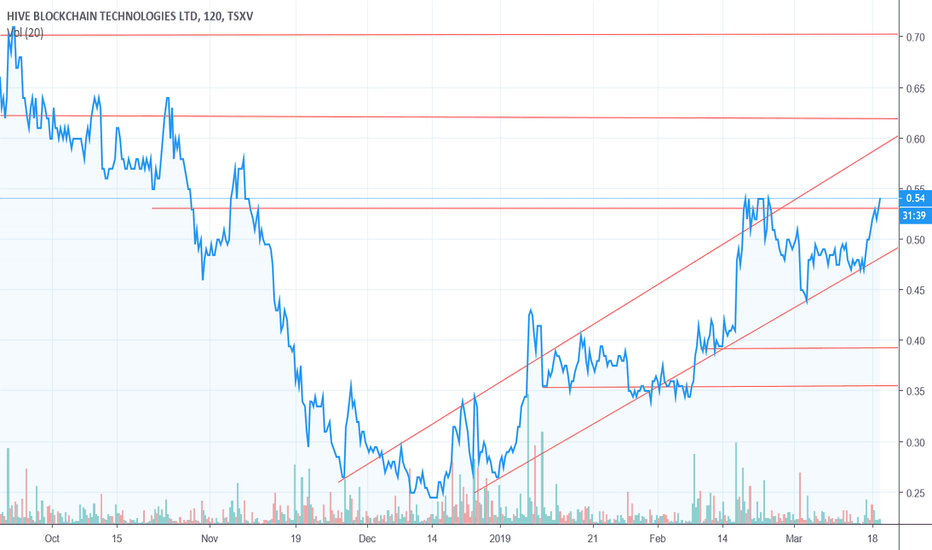
This chart displays resistance levels Hive will have to break through in order to continue its recent trend. It almost looks like a rising wedge pattern.
Well, here is a chart I've done up on TNY real quick to take a look at the resistance levels & how high of a price increase Tinley appreciated previously with what volume. I'm not the best chart guy so I'll just give my thoughts & anyone else can obviously chime in. Also, now that edibles regulations & U.S legalization via "states act" or "federaly" is...
Well, here is a chart I've done up on TNY real quick to take a look at the resistance levels & how high of a price increase Tinley appreciated previously with what volume. I'm not the best chart guy so I'll just give my thoughts & anyone else can obviously chime in. Also, now that edibles regulations & U.S legalization via "states act" or "federaly" is...


