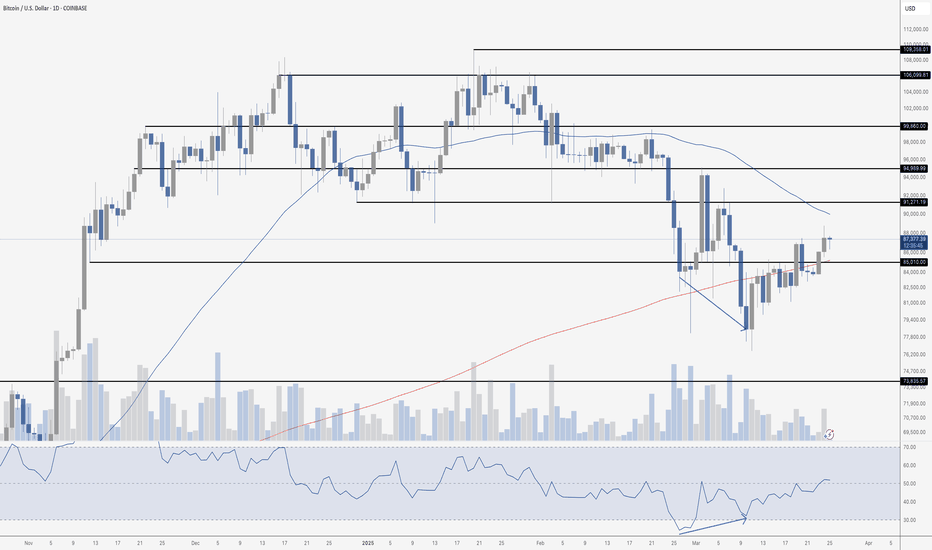
Bitcoin is starting to look pretty solid here. We’ve got a clear series of higher lows and higher highs off the bottom — exactly what you want to see for a bullish trend reversal. The 200 MA, which had been acting as resistance, has now flipped to support. That’s a big win for the bulls. Price has also broken convincingly above the $85,000 level, which adds to...
Bitcoin is finally waking up. After weeks of choppy action and failed attempts to break out, price has pushed decisively above the $85,000 resistance zone. The bullish divergence on RSI that confirmed earlier this month is doing its job — momentum is building, and buyers are stepping in. We're now flirting with the 200 MA, which previously acted as stiff...
Bitcoin continues to face resistance at the 200 MA, which it briefly reclaimed earlier this week before failing to hold. The rejection confirms that the 200 MA remains a key barrier, with price currently trading below it. We're still stuck between $85,000 resistance and the broader support zone around $77,000. Volume remains unimpressive on this bounce,...
Solana is forming a textbook ascending triangle on the 4-hour chart, which is generally considered a bullish pattern. Ascending triangles are characterized by higher lows (signaling increasing buying pressure) and a flat resistance line at the top – in this case, around $136. The structure indicates that buyers are stepping in at progressively higher levels,...
Bitcoin is simply riding the 200 MA as resistance… if it breaks up, we have something to talk about.
Either this is the generational bottom for Ethereum vs. Bitcoin, or it breaks support, stays there, and the party is over. I would bet on the former, but there is always risk.
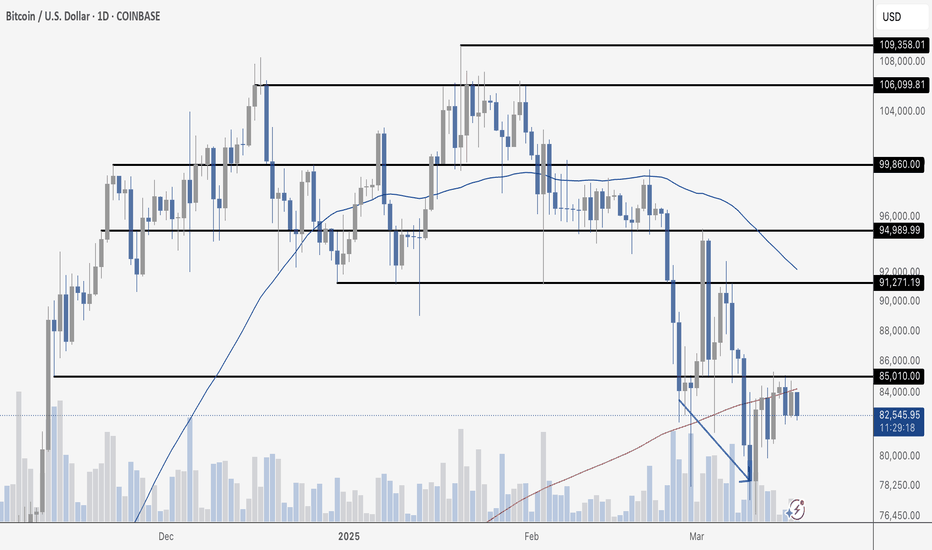
Bitcoin is stuck in no-man’s land after the recent bounce from the $77K low. The 200 MA (red) is proving to be a stubborn ceiling, with price grinding just below it around $83.6K. Bulls have made progress, but the lack of volume on the bounce suggests they might be running out of gas. It’s a classic "show me the money" situation – without stronger buying...
Bitcoin has confirmed a bullish divergence on the daily chart, with price making a lower low while RSI formed a higher low — a classic signal that downward momentum is weakening. However, the follow-through has been weak so far, with Bitcoin now consolidating beneath the key resistance at $85,010. The 200-day moving average (around $83,645) has not provided...
Bitcoin confirmed a bullish divergence on the daily chart, with price making a lower low while RSI formed a higher low. This is a classic sign of weakening downside momentum and potential for a trend reversal or at least a short-term relief rally. However, the 200-day moving average (around $83,645) is now acting as resistance. Bitcoin briefly tested this level...
Bitcoin is now facing resistance at the 200-day moving average (currently around $83,645). After bouncing from recent lows, price is struggling to reclaim this key level, which aligns with prior support turned resistance. A clean break above the 200 MA would be a bullish signal and could open the door for higher prices, but for now, this area is acting as a...
Ladies and gentlemen, the Ethereum Time Machine! Welcome back to 2020. Ethereum’s weekly chart against Bitcoin has reached a major historical support level. This is a critical area where price previously found a strong base before launching into the 2021 bull market. The current retest of this zone suggests that buyers could begin stepping in here, although...
Bitcoin’s daily chart is showing a significant shift in momentum, with a confirmed bullish divergence now in play. The price made a lower low while the RSI printed a higher low and has since turned upward, confirming the divergence. This is a strong signal that downward momentum is weakening, and buyers are stepping in. The RSI has now exited oversold territory,...
Bitcoin’s daily chart is showing a strong recovery from the recent low around $76,500. I have had standing bids at $77,000 for weeks, which finally filled. The chart is now presenting an unconfirmed bullish divergence — price made a lower low while the RSI held a higher low and is now turning up from oversold territory. This is a classic reversal signal,...
Bitcoin’s daily chart shows a key technical shift with the loss of the 200-day moving average (red line), which is now acting as resistance. The 200 MA had been a crucial support level throughout the recent correction, but Bitcoin failed to hold above it, reinforcing bearish pressure. Price dropped as low as $80,027 before bouncing strongly, indicating buyers are...
Bitcoin’s daily chart is showing rejection from resistance at $91,271, signaling that the recent bounce might be losing steam. The price failed to hold above this key level and is now back below it, indicating potential weakness unless buyers step in quickly. The 200-day moving average remains intact as support, which is a critical level to watch. If price...
Bitcoin's daily chart continues to recover after testing the 200-day moving average, which acted as strong support. $91,271 is currently acting as resistance. Volume remains elevated following the massive rebound from $85,010, showing clear demand at lower levels. The next major hurdle is at $94,990, where sellers previously stepped in. A daily close above this...
Bitcoin's daily chart continues to show strength after a strong bounce from the 200-day moving average, which acted as key support. The price is now consolidating below $91,271, an important resistance level that bulls need to reclaim for further upside momentum. The recent surge in volume suggests strong buying interest at the lows, reinforcing the idea that the...
Bitcoin's daily chart is showing potential bullish divergence, a key signal for a possible reversal. We still need a clear upward elbow on RSI with a higher low and for price to close at a lower low to fully confirm the divergence. The 200-day moving average was tested and is currently acting as support, reinforcing its importance as a key level. The recent...


