SeaSide420
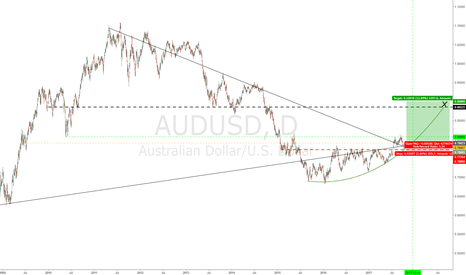
USA Gov focus on Biz growth = force USD down and on 14 Dec surprise rate hold by Fed ? meanwhile AUD mineral based economy go up with XAU ? on chart: Ancient lines cross, was that a double bottom? < higher lows curving upwards, previous resistance becomes support ? 0_o ...
LonG, TP from weekly chart. SL is no. No Accept LoSS, only win :-) Previous resistance becomes structure, which is ancient resistance level from weekly. Indicators have turned up across most timeframes FIB, ICHIMOKU , MACD , HULL MOVING AVERAGE some news stuff and also supply & demand
short term Long & long term Short & long term Long structure,moving averages,fib LOL
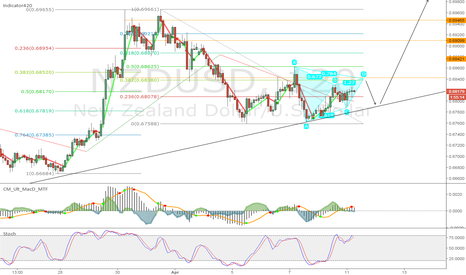
structure support becoming resist, fib to get 1.272 3 Pivot lines (different settings each one, where they bunch up is TP's) Fib lines up with Pivots SAR, price under ichimoku cloud, NmacD420, SS420FX all showing sell on 1 hour chart of FX:NZDUSD
Moving average indicators and structure Looks like sell across multiple timeframe why would it test the old support (previous old resistance)? or why not lines up with pivots.... before news, why not it test its good old support/resist line from exactly 1 year ago! o_0
looks like a buy to me, up to there at least (TP 1.12060) SL not too far... risk/reward ratio: 4.20
Structure - after break move down, price crept up to previous support before break (now resistance) FIB - which also lined up with the 0.618 retract. 1.272 extension at previous support & trendLine for TP - upcoming NZD rate cut likely
Looking at my charts was showing AUD/USD was a long and NZD/USD a short, usually the pair move together. So looking at AUD/NZD structure, confirmed the opportunity. Price has gone below 14 year long support/resistance line, and I expect it will go back up to test that line, which happens to be near a recent structure fib retractment line. While below Ichimoku...
Elliot wave, FIB, structure, Indicators. Elliot wave: expect double top, then ABC downwards move Risk/Reward Ratio: 4.20 AUDUSD
Elliot wave, FIB, structure, Indicators. Elliot wave: expect double top, then ABC downwards move Risk/Reward Ratio: 4.20 NZDUSD
In 2008 crash stocks down DXY up. Now in 2016 if stocks fall DXY climbs? Selling stock is buying $.... right?
01001001 00100000 01100111 01100001 01110110 01100101 00100000 01100001 00100000 01100011 01110010 01111001 00100000 01101111 01100110 00100000 01100001 01110011 01110100 01101111 01101110 01101001 01110011 01101000 01101101 01100101 01101110 01110100 00101110 00100000 01001001 00100000 01110011 01100001 01110111 00100000 01100001 01101110 01100100 00100000...
Supply&Demand cross over, restricted manipulation Silver be set free tp1- $50 tp2- $70
a sell TP 0.6850 area SL 0.6970 area RR is meh, maybe wait for epic long down at the 0.6850 area
little sell if bearish gartley completes at 0.6838-tp=0.68 then big buy if bounce off 0.68-tp=0.7178 sL's set above/below previous structure or fib
a buy (when bullish gartley point D is reached)


