Bearish Forecast for the Dow Jones Starting May 15, 2025 The Dow Jones Industrial Average is poised to begin a significant decline, potentially as early as today, May 15, 2025, targeting a retest of the price low from April 7, 2025 (~36,611.78), and possibly lower. This movement is driven by renewed trade tensions, disappointing economic data, and bearish market...
Bearish Forecast for Major Indices Starting May 15, 2025 The S&P 500, Dow Jones, Nikkei 225, and other major indices are poised to begin a significant decline, potentially as early as today, May 15, 2025, targeting a retest of the price lows from April 7, 2025, and possibly lower (S&P 500: ~4,802.20, Dow Jones: ~36,611.78, Nikkei: ~30,340.50). This movement is...
Decided to enter Zerebro for the public portfolio; AI agents are growing well. Potential upside: +140%. Zerebro (ZEREBRO) is a decentralized AI system on the Solana blockchain, creating and distributing content across social media and crypto communities. Using RAG technology, it generates unique texts, NFTs, and memes, avoiding templates. Operates on X,...
XAI Agent GORK. Elon Musk is on board? #Gork — is a meme coin operating on the Solana blockchain, inspired by the XAI Grok chatbot. It gained significant attention due to its humorous and satirical nature, with notable interactions from influential figures like Elon Musk. The coin has experienced rapid market activity, including high trading volumes and...
We expect Bitcoin to reach around 80-83k. Closer to the time, we’ll monitor and look for entry points in altcoins 🤔. During this rapid rise, Bitcoin was actively sold on the Bitfinex exchange, +1 for a correction:
S&P 500 Braces for a Drop to $5,100–$5,177: Is the Correction Coming? SP500 Reached the target of $5,680 - $5,800 and is going into correction along with Bitcoin 🤔. Before: After: ➖ The S&P 500 could fall to the 5100–5177 range due to the following fundamental factors: FOMC Meeting on May 7: Expected rate hold and potentially hawkish rhetoric from Powell...
Dow Jones Correction in May 2025: Key Drivers Summary: The Dow Jones Industrial Average (DIA) is under pressure and likely headed for a correction due to the Federal Reserve’s tight monetary policy, trade uncertainty from Trump’s tariffs, and weak economic data. Key Drivers: ➖ Federal Reserve Policy: At the May 6–7 meeting, the Fed is expected to...
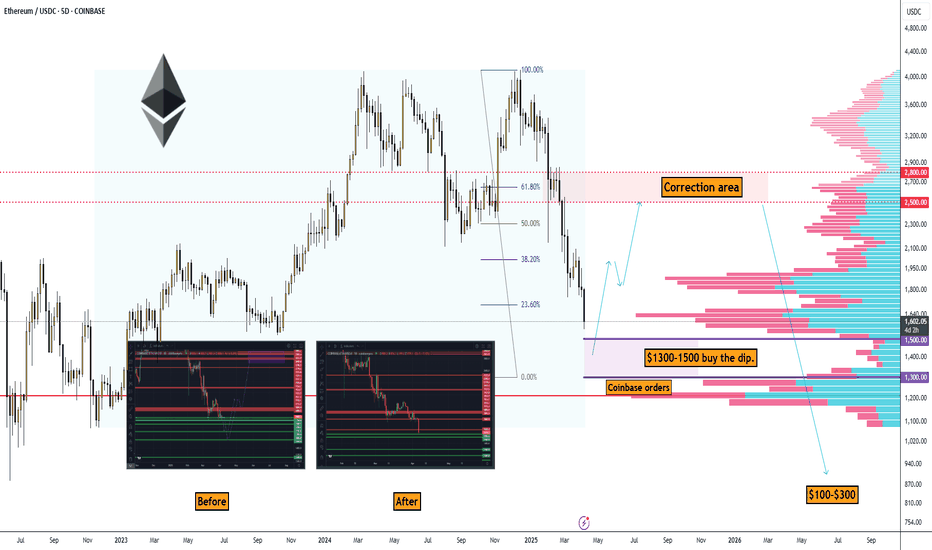
#Ethereum Price Analysis: Correction to $1,300–$1,500 Before Potential Rise to $2,500–$2,800 Let’s break down why Ethereum (ETH) might correct to the $1,300–$1,500 range and then potentially rise to $2,500–$2,800 (with increased risk beyond that). Technical Analysis On the ETH/USDC 5-day timeframe chart from Coinbase, key points confirm a correction to...
Memecoin: A Modest $60 Trade in Mumu on Solana ➖ Bitcoin is growing slowly for now, and today I noticed that altcoins and memecoins have become more active. ➖ I decided to try investing a modest $60 in the memecoin Mumu, which has the potential for a +120% move. ➖ I'm not expecting massive gains; the lows have closed higher, similar to October 2024, with a...
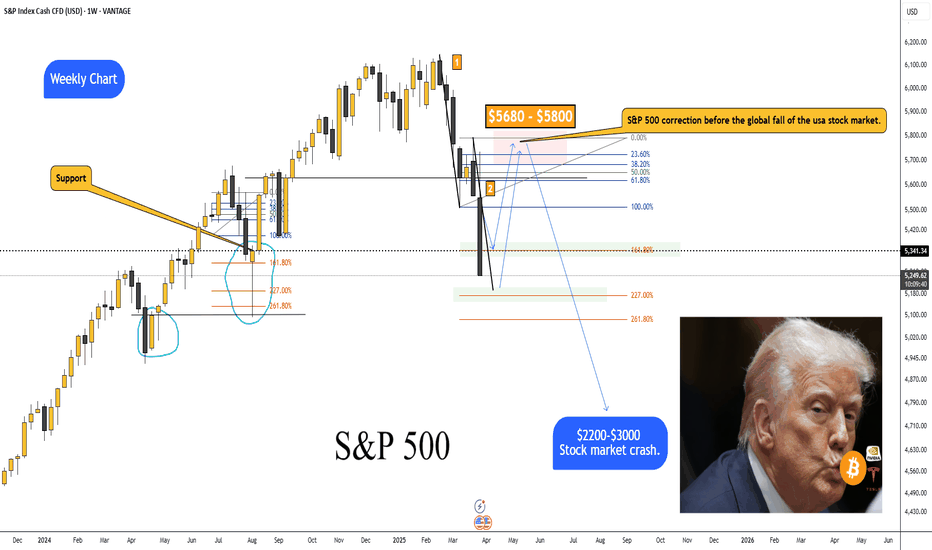
S&P 500 correction before the global fall of the usa stock market. Hey traders! I’m sure many of you have noticed that after the introduction of retaliatory tariffs, the markets started getting pretty choppy. The S&P 500 took a serious dive. • On the weekly chart, I’ve marked a support level + the 161.8% Fibonacci level, where we might see a bounce back to the...
Brief Overview of Events and News Explaining the Potential Decline of Brent Oil Price to $50 in the Near Future. ➖ Increased OPEC+ Production: On April 3, 2025, eight OPEC+ countries unexpectedly decided to accelerate production increases, adding 411,000 barrels per day starting in May. This decision triggered a price drop, with Brent falling 6.42% to $70.14...
Brief Overview of Events and News Explaining the Potential Decline of Natural Gas Prices to $2.43–$2.74. ➖ Weather Forecast and Reduced Demand On April 23, 2025, the U.S. National Weather Service forecasted milder-than-average weather across the U.S. for late spring and early summer 2025, particularly in key gas-consuming regions like the Northeast and...
Let’s break down why Solana (SOL) might correct to the $75–$85 range, considering fundamental factors, news, events, technical analysis, Coinbase orders, and on-chain activity. Fundamental Factors Solana is a high-performance blockchain known for its speed and low fees. However, in 2024–2025, it faces several challenges that could impact its price. One of...
Bitcoin correction. Waiting for 70k-76k The previous idea suggested Bitcoin would reach $95,000-$100,000 before entering a 1-2 year bear phase alongside the U.S. stock market decline. Bitfinex: However, based on Coinbase orders in the $70,000-$76,000 range and recent BTC sell-offs on Bitfinex over the past three days, it looks like this correction is being...
Gold is reversing before reaching the round $3,000 mark. As you can see on the chart, we’ve hit the 227% Fibonacci level. — Back in 2008, after testing this level, we went into a correction. — I think we might see a similar scenario play out from here. Dollar Index: SP500/SPY:
Gold has soared very high and reached 227% on Fibonacci; you can try with a short stop loss on a breakout at $3123.00. Trade 1 to 10. Trading orders: Short on price breakout: $3123.00 Stop Loss: $3141.00 Take Profit: $2943.00 12H Chart:
Tesla stock has completed 5 downward waves Currently, market sentiment is highly negative. A correction to the $296-$326 area, which corresponds to 38.20 and 50% Fibonacci levels, seems likely. They have also covered the gap from below. After Tesla stock's correction, I expect a global collapse of the SP500, the US stock market, and the cryptocurrency market....
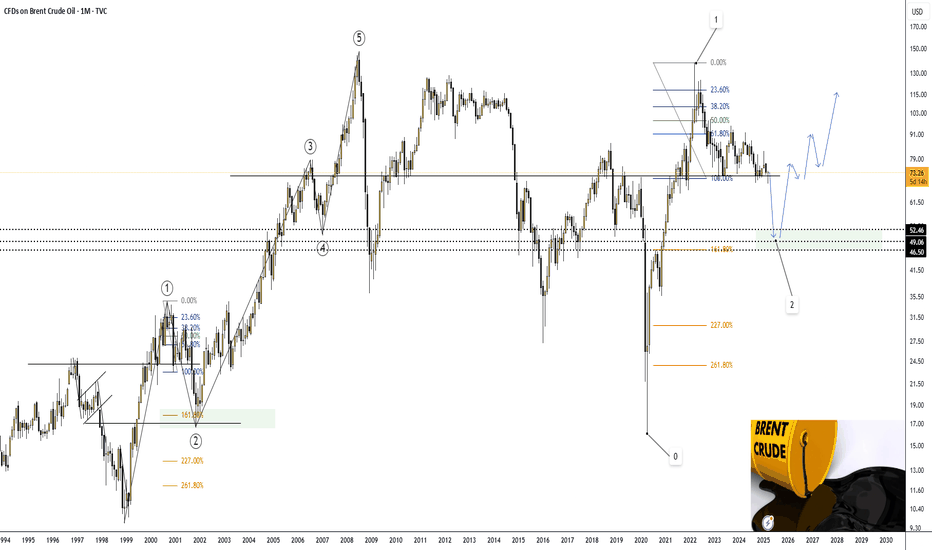
A major correction in Brent crude oil (UKOIL). - This idea is invalidated if the price exceeds $73.755. On the monthly chart, it shows that we are forming a 50% Fibonacci correction from wave 1, from where we will further expect growth toward the $115 area, and possibly even a new all-time high due to a military conflict in the Middle East. I’ve marked...


