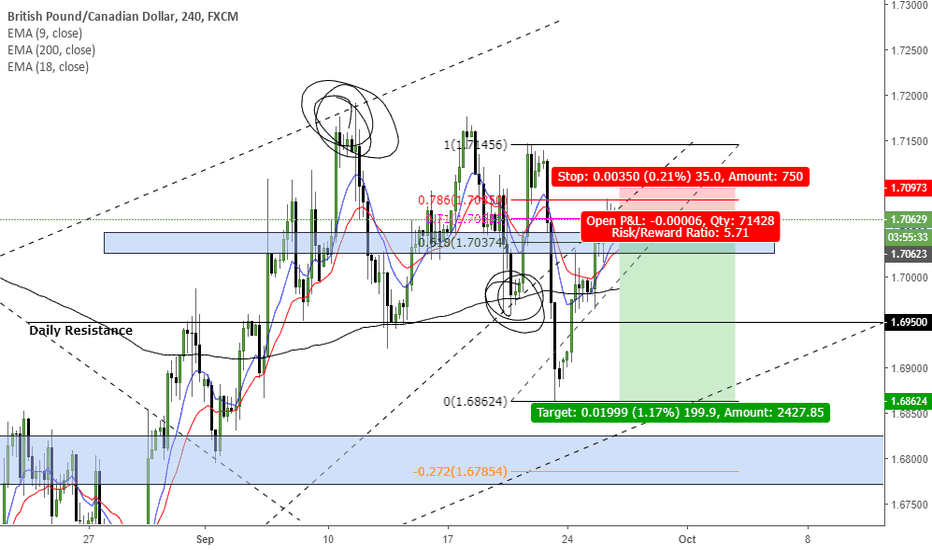
Price seems to be respecting broken trendline bais is to the downside, will look for a sell setup on smaller time frame
Will wait for a bearish engulfing candle stick or retest of trendline after its broken.
Price broke ascending trendline will look for a short setup on smaller time frame
Given the strength of the Euro compared to the Aussie in higher time frames and price failing to break zone creating a double top with a massive wick, the bullish trend is due for a correction, price is in an ascending channel. waiting for break of this channel then bias is on sell positions to the marked zone.
Price in bullish trend on smaller time frame, touch on the trendline, possible ABCD pattern forming to 168 fib retracement
Price inside H4 bearish trend and possibly ranging on Daily timeframe, bias is to the down side.
Trend bearish, double confluence on retouch of bearish trend-line and price action zone 61.8 - 71.0 fib retracement from previous higher low.
Price in a weekly range, Possible ABCD correction forming on 1Hr chart since last weeks drop of more than 300+ pips
Price in Possible Ascending triangle, close to D leg of triangle and looking for buy to E leg should price show signs of weakness at trend line.
Dollar very strong against major pairs, currently price on a bearish run to 2018 price low. Question is if price will create a double bottom or break through, we'll just have to wait and see. Bias is long @1.13050 should price show any signs of weakness.
Possible retest of bullish trend before price drops to the downside
Pair in bearish trend after massive bullish run due to dollar strength, possible retest of bearish trend line then back to 127 Fib extension.
Price in bullish range possibly heading to the downside to moving average
Possible Monthly ABC correction forming and hoping prices drops ones it reaches the zone *TIME WILL REVEAL ALL*


