Shankt
I have no idea how to sine waves are used to chart markets, but I did it anyway. The math adds up but this is highly speculative-- probably nonsense :-P
Bitcoin seems close to completing a cup & handle pattern. We're looking for a break up from the handle at 2775, after which the price should make a strong move upwards. This move takes us across a major resistance level ($3000 usd which is also ATH), so inital target is $3000 with a potential of $3125. See patternsite for a detailed analysis of this trading...
Published for a friend. I'm not sold on EW, so take this with a grain of salt. Using fibs, I would plot the potential EW impulse this way.
There is a massive triangle pattern forming on the XMR (Monero) weekly. There is potential for big gains on an upside breakout and several opportunities for scalping in the meantime. Happy trading!
The BTC bottom looks to be in. Price action is currently in a Descending Broadening Wedge pattern. Target is 2800 for a topside breakout.
Since April of 2016, USOIL has been in an uptrend on longer time-frames (4h and up). The price is nearing the bottom of the channel as we approach the warmer seasons for the northern hemisphere, when consumption is high. Political factors also indicate a strong year for USOIL, making this a good opportunity for a big long. Enter Limit@$47.6; SL-$46.50; TP-$57.00
I'm already in long, but since I had this charted for someone else, I thought I'd publish. GOLD rallied Friday and looked to be completing a bull pennant pattern at market close. This is as "textbook" as a pennant pattern gets, and sitting there all weekend gives traders a chance to notice and set orders. There may be a little chaos on market open, but I think...
US Oil has political support and we're headed into a season of greater consumption. This combined with the recently completed H&S leading into an ascending triangle indicates that there is a strong move coming. Enter at 55.10 as price breaks up from the triangle. SL set very tight (because I'm a noob to trading oil)
Yellen speaks today, and the general consensus is that there will be a confirmation of three fed rate hikes in 2017. However, the negative correlation between GOLD and fed interest rates is disputed with some sources placing this correlation at a statistically insignificant 28% (www.investopedia.com) TA reveals that GOLD broke upward of a falling wedge and is now...
Having completed an Elliot Correction Wave, bitcoin is primed to start climbing again. Long entry after touching .382 on the fib trend at 6600 with an initial target of 7150 and a secondary target of 7405. There should be an opportunity to add to the position at point 4 in the wave. Stop is set short at structural support
I'm new to trading, so take this with a big 'ol grain of salt. The downtrend in GOLD has potentially been reversed. Recent political changes that have introduced a threat of new tariffs and talk of a 'trade war' are the most likely cause. This surge in the bitcoin price has a potential for big gains. If you're not already long, there is still plenty of upside...
Having completed an Elliot Correction Wave, bitcoin is primed to start climbing again. Long entry after touching .382 on the fib trend at 6600 with an initial target of 7150 and a secondary target of 7405. There should be an opportunity to add to the position at point 4 in the wave. Stop is set short at structural support
Bitcoin seems to have hit bottom and is approaching the apex of an ascending triangle . Looks like a good opportunity, but there is a chance that this beast will have a third leg down, so I'll be setting a tight stop. Long entry at $840 targeting $910 with a stop-loss at $830 for a Profit Loss Ratio of 7:1.
ETC seems to be completing a C&H pattern. A breakout (.001425) should see a 30% gain.
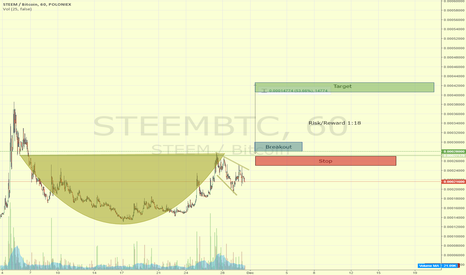
General consensus on STEEM is that it is a turd of a coin-- a sentiment I share. However, the market rules-- supply and demand trump any perceptions. STEEM is completing a solid cup & handle pattern. This presents a nice opportunity with a risk/reward ration of 1:18. Bitcoin's increasing value may extend this handle out for quite some time so I don't expect an...
A falling wedge is often considered to be a bearish pattern , and in these cases the break down is usually accompanied by decreasing volume. Alternately, consistent or increasing volume at the apex of the Triangle can precede a strong break upward as a continuation in the longer-term uptrend.


