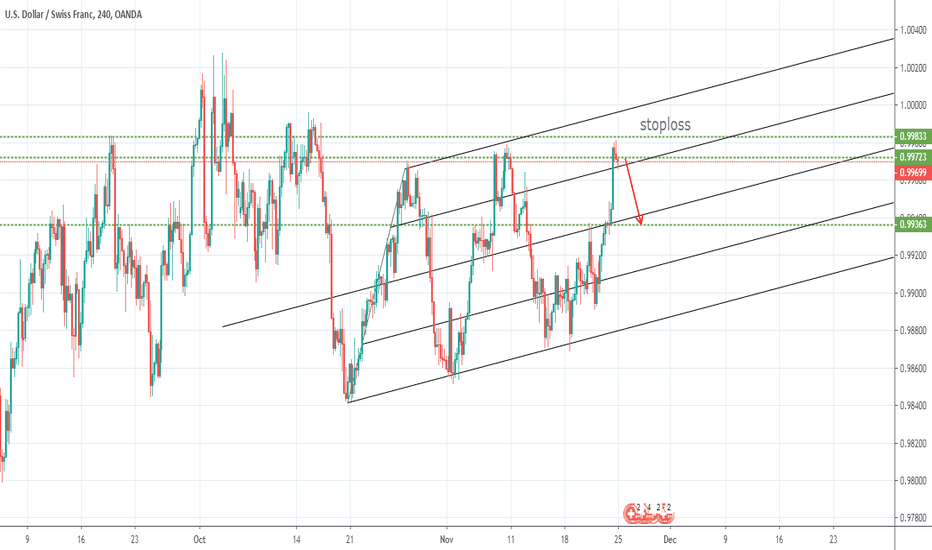
Price hit supply zone Neccessary for pull back ==> Sell Plan as the picture
Price hit gold point of fibonacci : 61.8 Supply zone => Sell
Price hit support zone and demand zone In H4 time frame : Bullish Pin bar => Buy
Price hit support zone and demand zone Price hit fibonacci 50 Neccessary for pull back => Buy Plan as the picture
Price hit resistance Waiting for pull back and entry sell Using Price Action and Andrew Plan as the picture
Structure : Sideway on the top in daily time frame Using supply demand zone => Sell Plan as the picture
Price hit support and demand zone in daily time frame Structure in H4 : Uptrend Counter trend Entry in H4 time frame and target in Daily time frame Plan as the picture
Structure : downtrend Daily: Downtrend H4: Downtrend Sell limit by using fibonacci and price action Plan as the picutre
Structure daily: Downtrend Structure H4 : Downtrend sell limit on H4 by using fibonaci and price action Plan as the picture
Counter trend GbpJpy Sideway on the top in daily time frame Bearish Engulfing in weekly time frame Entry sell limit in H4 time frame by using fibonacy and price action Plan as the picture
Daily time frame: Downtrend H4 time frame : downtrend Entry sell limit on H1 time frame by using price action and Crowd psychology plan as the picture
Structure : dowtrend Type : counter trend - go long Price In the demand zone that exist inside bar before Plan as the picture
Structure: Uptrend Type: Go up Entry go long Price in the demand zone in h4 time frame Plan as the picture
Structure: Downtrend Daily candle pattern confirm Entry on H4 time frame by using fibonaccy, price action, Crowd psychology Sell limit in the supply zone Plan as the picture


