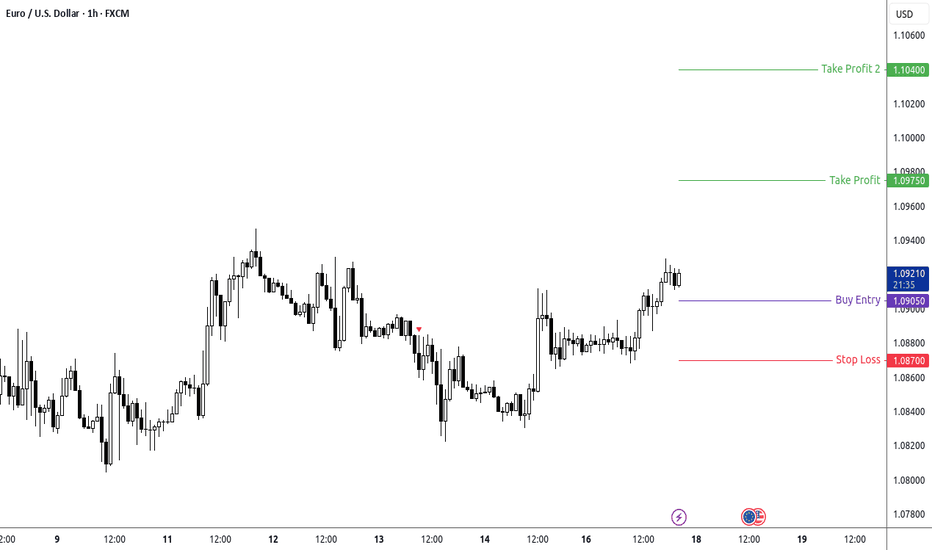
Analysis of EUR/USD Bias: Bearish The EUR/USD pair is showing bearish momentum across multiple timeframes. On the 4-hour chart, we can see a clear rejection from the 1.1150 area, with price now trading around 1.0930. The recent price structure shows a lower high formation after a strong bearish move from the 1.1150 resistance zone. Market Structure: The 4-hour...
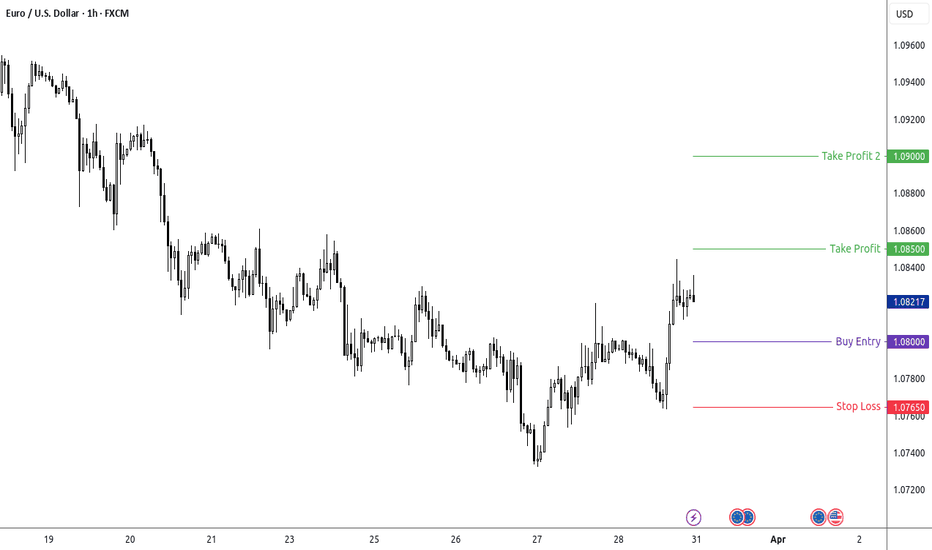
Analysis Bias: Bullish with caution Market Structure: The EUR/USD pair is currently trading at 1.0821, showing bullish price action in the most recent days after a period of decline. Looking at the 4-hour chart, we see a strong upward move in early March followed by a correction and consolidation phase. The price is now attempting to form higher lows after...
on 1H Chart price is testing the broken Support as Resistance could be nice RR
one of those trade where I should have put the SL as entry
Bias: Bearish Market Structure and Reasoning: The EUR/USD has been in an overall downtrend in recent days, forming successive lower highs and lower lows across multiple timeframes. The 4-hour chart shows a clear bearish momentum with price recently breaking below key support levels. On the 1-hour timeframe, we can observe a series of bearish candles with minimal...
Looking at the EUR/USD charts across the 15-minute, 1-hour, and 4-hour timeframes, here's my price action analysis: Bias: Bullish Market Structure Analysis: The 4-hour chart shows a clear bullish trend that began in late February, with EUR/USD making consistent higher lows and higher highs. After the strong rally from around 1.0400 to 1.0950, price has...
Bias: Bullish Market Structure Analysis: The GBP/JPY pair shows a strong bullish trend across all timeframes. On the 4-hour chart, price has established a series of higher lows and higher highs since late February. The recent price action shows a decisive breakout above the 194.00 resistance level, which is now likely to act as support. The 1-hour and...
Trade Bias: Bearish - but maybe only for next week... need to wait Looking at all three timeframes (15m, 1H, 4H), we can observe that while EUR/USD had a strong bullish trend from late February through early March, price action is now showing signs of exhaustion and a potential reversal. The recent price action shows a failure to maintain the highs above 1.0950...
Trade Bias: Bearish The 4H chart shows a clear bearish trend with lower highs and lower lows since late February. The pair recently made a lower high around 162.400 and has been declining. The 1H chart confirms this bearish sentiment with price recently rejecting from the 161.000 resistance level. Entry Price: 160.900 Looking to enter on a pullback to the...
Trade Bias: Bearish Looking at all three timeframes, we're in a bearish cycle on the 4H chart after a recent rejection from the 0.6340-0.6360 resistance zone. On the 1H chart, we can see a recent pullback that may be losing momentum, setting up a potential continuation of the downtrend. Entry Price: 0.6287 Looking to enter short on the current pullback to the...
Looking at all three timeframes (15m, 1H, and 4H), I can provide a comprehensive analysis that aligns the shorter-term opportunity with the larger timeframe context. Multi-Timeframe Assessment 4H Analysis: Price is in a clear uptrend after establishing a significant bottom around 155.00 We've seen a strong recovery from recent lows to current 161.59...
Waiting to see a break and retest of the entry price rather than placing a buy stop order. Here's the plan: Watch for price to break above 160.250 with a decisive candle (preferably closing above this level) Then wait for a pullback to retest this level as new support Enter long when price shows rejection from the retest level (with a small bullish candle or...
Just entered a bearish position on USD/CAD at 1.4350 with clear technical alignment. Price reached our sell zone after recent rejection from higher levels. Trade Details: Entry: 1.4350 (sell zone) Stop Loss: 1.4420 (above recent swing high) Take Profit 1: 1.4260 (previous support) Take Profit 2: 1.4150 (major support) Risk-Reward: 1:2 for first target, 1:3.5 for...
Looking at GBP/JPY 15-minute chart, we've identified a symmetrical triangle formation suggesting continuation of the recent bullish momentum. Trade Setup: BUY @ 191.80 (Triangle resistance breakout) SL: 191.50 (Below triangle support) TP1: 192.20 (Previous resistance) TP2: 192.50 (Key psychological level) Risk:Reward = 1:1.33 (TP1) and 1:2.33 (TP2) This setup...
Trade Setup: Symbol: USD/JPY Direction: LONG Entry: 149.95 Stop Loss: 149.65 Target 1: 150.40 Target 2: 150.80 Risk:Reward: 1:1.5 (primary) / 1:2.8 (extended) Analysis: USD/JPY is showing signs of bullish momentum after consolidating near the 149.80 level. Price action on multiple timeframes indicates a potential upside break. The recent higher lows on the...
OANDA:CADJPY Analysis 4-Hour Chart Analysis The 4-hour chart shows CAD/JPY in a clear downtrend with lower highs and lower lows. Key observations: Price has been declining from around 110.500 to current levels around 103.079 Recently formed a potential double bottom around 102.500 level Currently showing some consolidation/minor bounce from these lows Price...
EUR/USD Short-Term Trade Setup Entry: 1.0491 (current price) Stop Loss: 1.0465 (below recent swing low) TP1: 1.0520 (previous resistance level) TP2: 1.0550 (extended target at next significant resistance) Current price action shows a bullish continuation pattern after a recovery from the March 1st drop. The 4H chart confirms an uptrend with higher lows forming...
Trade Setup for AUD/USD Trade Bias: Bearish with Caution The broader trend remains bearish based on the 4H chart showing a clear downtrend from late February. However, I notice potential bullish divergence forming as price makes a temporary bottom around 0.6155-0.6160. Entry Price: 0.6215 Looking at the current price (0.6156), I recommend waiting for a...


