Zynga currently offers a very bullish set-up Multi-year break out followed by weeks of consolidation
I can't see Disney taking meaningful shares from Netflix but the chart is rather bullish Break out & gap up after good earnings (announcement of Disney plus) Stock has been consolidating for a few months, since gap up Trading between the low $130s, high $140s. A break above $140 and this can potentially hit $200.
GOLD broke out of multi-year resistance in August of 2019 Showing extreme strength Recently ran into secondary resistance of around $142-$144 If we surpass $144, GOLD can see levels it hasn't seen since 2011 Between 2011-2012, GOLD traded between $150s-$180s.
IWM is within a 2 year channel with distinct points. Lower end (red arrows) around $144-$145 Upper end (black arrows) around $160 Highlighted areas are times in which we breached those areas. Yesterday the IWM traded down as low as $144.25, buyers stepped in to drive the ETF up. Buyers have stepped into and bought around that area for the past 2 years. ...
range: $281.72-$294.15 Going long the lower end of the range and shorting the upper end of that range has been profitable for the past few trading weeks.
Possible Double Bottom at $5.10 Stock looks like its ready to run and run fast If $5.10 can represent the low going forward, we break above multi-year resistance of $6.50 and hold; might get a double here! Time will tell.
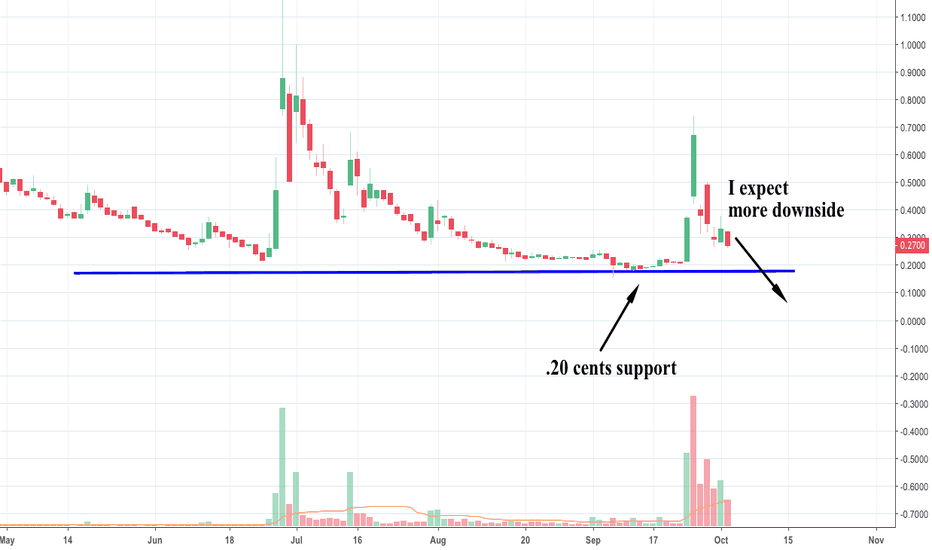
Bearish on this stock clearly drifting towards support of around .20 expect a pop the closer you get to .20 ultimately; stock might breach support at .20 intermediate target = .15 cents.
Despite the political rhetoric, stock has a bullish setup 3-4 years of consolidation, followed by a break out a few more months of consolidation, followed by another break out currently in an uptrend May experience some slight pullbacks but overall, bullish.
Bullish on GLW A lot of bullish signals in the past few weeks rounding bottom earnings gap up a few weeks of consolidation break out of consolidation base
Volatile stock bullish long term on Tesla coming down to support buy long term support
I love the chart, however, it broke yearly support Unless it can reclaim its channel; I see further downside FYI: Jack Ma is set to resign on 9.10.18
Bullish set-up emerging rounding bottom break out consolidation break above $6 and I think we see $8
In my opinion, better quality stocks around However, stock is sitting on support If you're insistent on taking a trade on the long side, you can get a bounce off of support Trading at all time lows, does not bode well for any long position Sell the rallies.
Trading at all time lows broke two levels of support long red candle break down of support w/ accompanying volume A sustained break below $10 and it can get very ugly
8 month rounding bottom completed gapped up huge on earnings beat currently consolidating In my opinion, will retest 52 week highs and finally another break out.
9 year channel another attempt at breaking resistance If we can break resistance, price tgt: $10+
Up over 200% in 4 months Daily candles is bearish expecting a pullback in the shorter term
Support around $5 has held. Stock bounced off that area 3x (triple bottom) and is now north of 100%. Stock broke out of $8 resistance and seems to be heading for January high of $11.90. Bullish!


