Taking a small short position on USDCAD based simply on chart price action and fib extensions. First target the 0.786 and the 2nd the .886. The absolutely clear rejection of 1.387 is a great signal, stop loss placed abbove the wick of the previous weekly candle, will transition to a trailing stop after position starts to move.
Falling Wedge w/ RSI 4HR Bullish Divergence after dropping below 30, at an important reversal area looking left. Stop Loss below 19.33 , layering positions inside of reversal area.
Pennant Breakout resulting in a Bull Flag w/ a Double Top Looking for the gap to fill below 402.00 which also confirms the Double Top and the Bearish Breakdown of the Bull Flag Structure, Conservative Measured move (Patterns Measured Move * Percentage Meeting Target) puts it close to the Demand Line from Feb . 23 2023, marking a 5th touch point. Longer Term...
AMD breaking below critical support. - EDUCATIONAL POST - This is a POTENTIAL Trade Setup , an example of what I will usually do, wait for a break of the area, usually price has broken too sharply past said area to make a decent trade, placing an Entry at the 3:1 Minimum R:R Ratio, inside of a Bracket order, so when my entry is triggered, one ALREADY has...
Simple 0.886 retracement bounce trade, waiting for the confirmation of the Double Bottom DREW ALOT OF TARGETS FOR FUNSIES
ENR Entry after the 0.886 retracement bounce, playing the critical support of $26.63, tight stop below this level. 4HR Potential short term short opportunity, or wait for min-maxing the Long Opportunity. Weekly RSI Bullish Divergence & Weekly MACD Bullish Divergence LAC (Lithium Americas Corp) also bouncing at an 0.886 retracement with a potential Double Bottom...
After the break and back-test of 39.20, staying Short below this level into the 0.786 retracement of 6.96 -> 120.00 . Looking to close the short, and open into a Long if successful, also at the 0.786 retracement. In the event of a Stop Loss Trigger, the 0.886 retracement will be looked at as an area of entry with good variables.
BTCUSDT Descending Broadening Wedge Aggressive Trade Idea Playing a Long Setup of BTC's DBW w/ implied continuation with the formation of a Partial Decline. One should wait for the Breakout and Backtest of the DBW for the safest setup. Long time since I posted a setup, I plan on posting as much as possible, thank you all for continued support !
Future Support/Resistance Bounce, ready for both Supports, looking at playing the .618 retracement at what I believe to be a good accumulation area, thankfully there is plenty of time for more data.
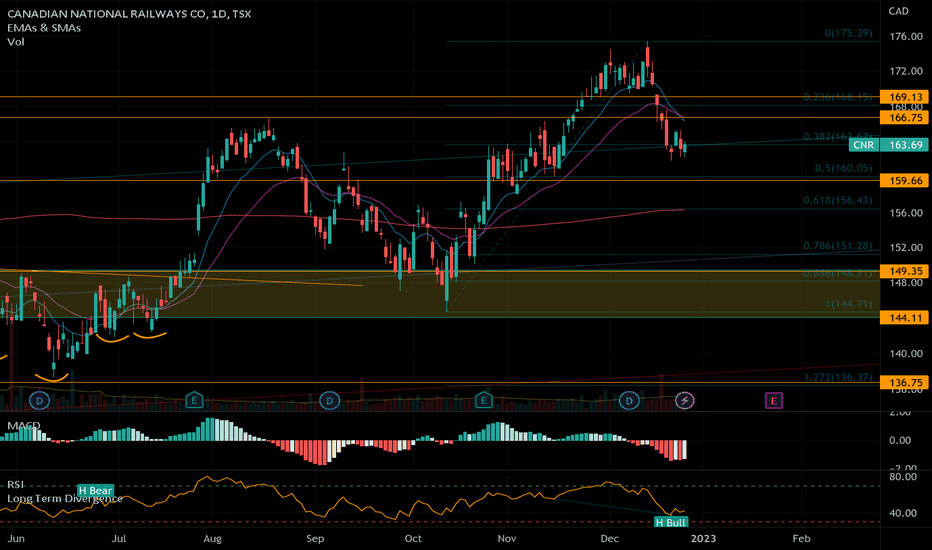
Looking to take a shot Longing CNR at the 50% Retracement, also a support level, waiting to see how the next few days go. Coming straight down to the 50% Retracement would put RSIs on lower time frames in a more favorable position as well
Early call of a lower timerframe Double Top, but with PPI coming out possible that the market reacts Bullishly destroying the idea, in that case looking for a retest of the Rising Wedge .
Simply at a level with 4 HR Hidden Bearish Divergence at Critical Area of the Flag, easy to assess risk Area Total Market Cap Also regarding as resistance in the same way, BTC Potential Early Head & Shoulders, not the best placement, could also be viewed as top of the flag, same goes for ETHUSDT. Again, waiting for PPI to destroy most of these setups and then...
Weekly Analysis, looking for a lower high compared to 22565 with Weekly Hidden Bearish Divergence on both RSI & MACD Using retraces for entries, tight stop at the .786 in case of possible reversal and full position at the .886 If you agree or disagree with the setup, please let me know and explain ! We're all here to learn and grow off each other!
McDaniels Short Idea Potential Early Observation of a Head & Shoulders& 4-Points (Less weight) Broadening formation, currently waiting for more data. Short Term Rising Wedge Longer Term Early Observation Head & Shoulders - > (4 HR Candle Close Right Shoulder Shooting Star ) Longer Term Early Observation Broadening Formation One of the Top 10 Holdings of the...
Double Top clearly closing below resistance w/ Daily Divergences Simple Support & Resistance trade, S&P looks ready for consolidation Higher Risk implied as Energy has been DOMINATING .
An Extremely aggressive short idea on the RUT if one didn't nail the Mother of All Trend Lines on the S&P500 Regarding support as resistance w/ Hourly Hidden Bearish Divergence on MACD + RSI , regarding Fast EMA as Resistance Daily Double Top Confirmation Line Broken
Diamond Reversal Head & Shoulders Reversal 3 Falling Peaks Below an Iceline Wedge-Ception ( 4HR Rising Wedge , Lots of White Space, Less Weight -> 15Min Rising Wedge )


