After a fall in CHFJPY, it holding at retest zone which is not a good sign for sellers, if the breakout was for real then it should have give the move downside but the consolidation saying it inviting the sellers and could potentially break upside after sweeping the liquidity of buyers.
EURGBP is Bullish and currently at trend line support we can expect a buy movement in EURGBP. The pair is bullish and also sentiments are suggesting to go long as retails are short heavily short so we can target their SL at top. Keep GBP Bank Rates are also upcoming and we can expect a 25 bps cuts to 4% from 4.25% which can make EURGBP fall so keep SL tight.
We can see that after NFP Bullish Move, EU is Holding and consolidating in rectangle, if we observe a breakout of 1.1600 on 1 Hour TF we can Expect it to move till 1.1700-1.17500. Although, we can see a consolidation for 1-2 days longs cause market always takes breaks after major economic event, and if any DXY affecting news comes from P. Trump or any other...
We can see a breakout in upside in EURUAD after this consolidation as EA already tested it's support and swept the sell side liquidity. Targeting 1.78500 Zone Again for Testing and also forming a triangle pattern in 4H. We can take a buy till that trend line test with tight SL.
EURGBP after getting rejected from the support we can expect again a upside movement. I am expecting a movement from 0.86500 to 0.8700 at least, we can plan sl below 0.86300. Safe Player wait for proper breakout and wait for retest of 0.8650 area.
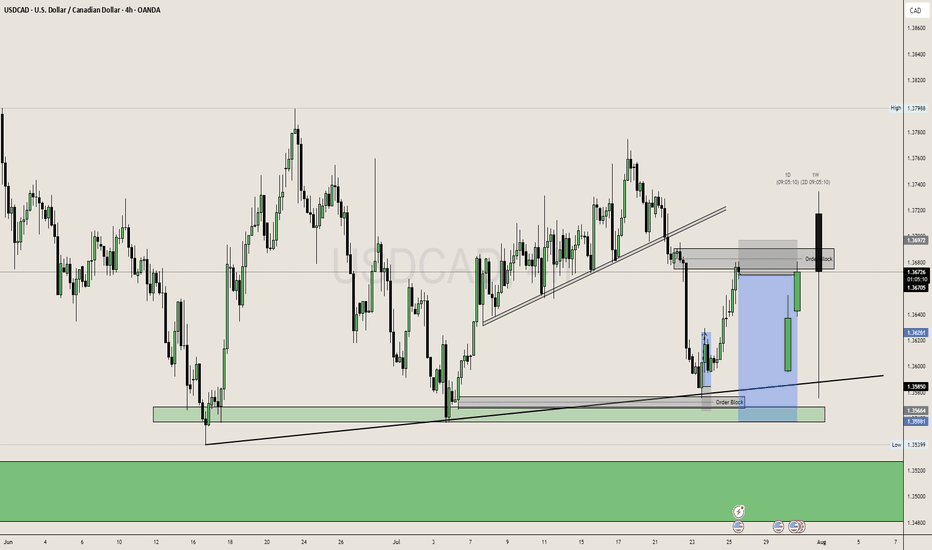
As USDCAD is in Downtrend, we can expect a sell side move from this OB in NY Session towards low SSL. Friday Closing also coming near so plan trade accordingly.
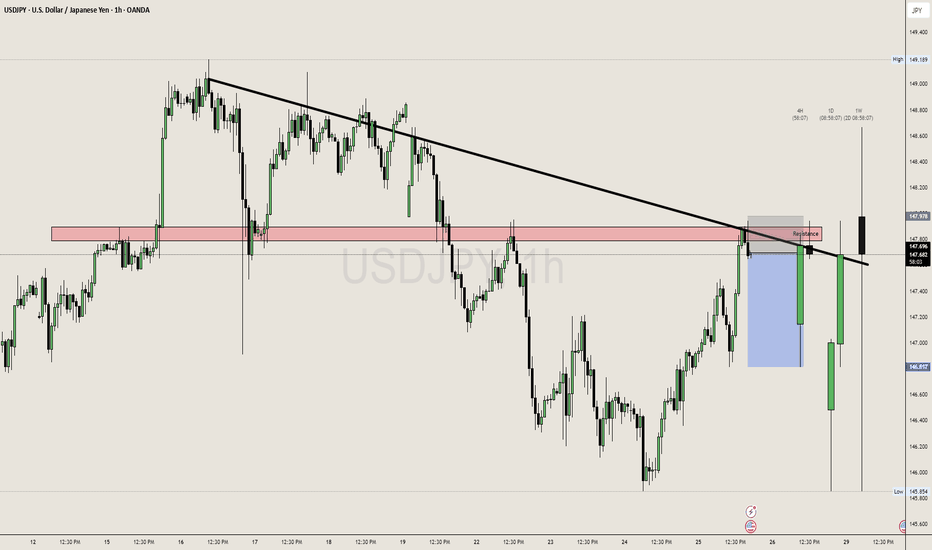
UJ is at 1H Resistance we can sell correction move towards sell side. Sentiments are for sell side so in bigger time it can break that zone but we can plan a instraday trade.
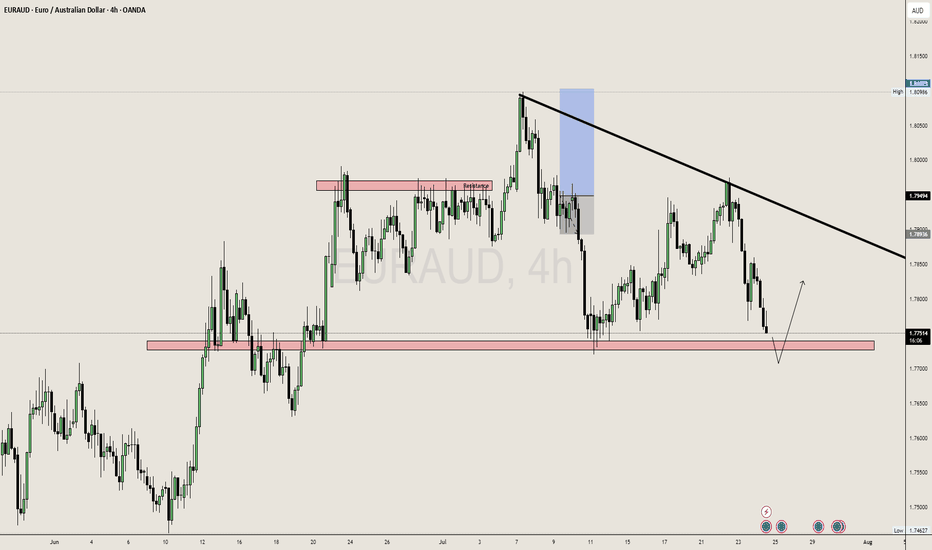
We can expect a buy side move from the support till the trend line. EA is Sideways in Daily we can plan the buy till the resistance zone/ trend line.
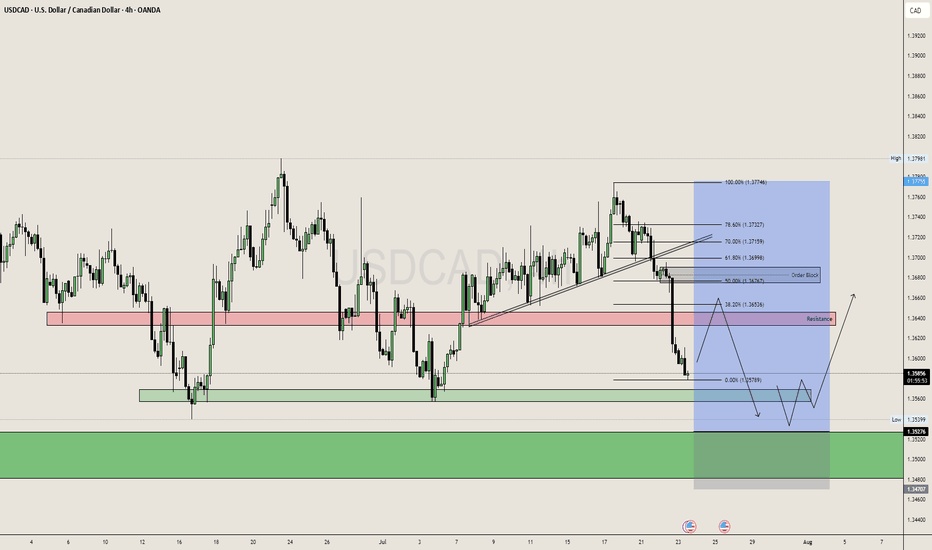
USDCAD is in Range in Daily, and daily range is enough to capture 200-250 pips. So keeping that in mind we can plan a buy trade USDCAD from the Daily Demand Area 1.3500 - 1.3550 Area. And 1H Trend is Bearish So we can also look for the Sell from the 1.3650 aka Resistance Zone (4H), but after this selling move it is risky to sell at current price i.e. 1.3580 So...
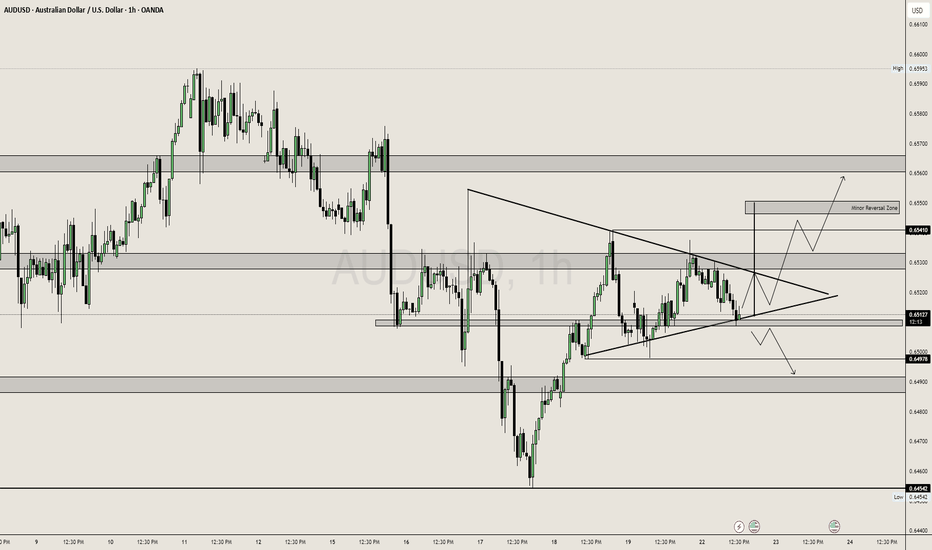
Price is consolidating inside a symmetrical triangle, showing indecision between bulls and bears. Before entering the triangle, the market showed strong bullish momentum, indicating a possible continuation pattern. Price is hovering near a key support level (0.6513) where multiple candle wicks suggest buying pressure is defending. 🔍 Key...
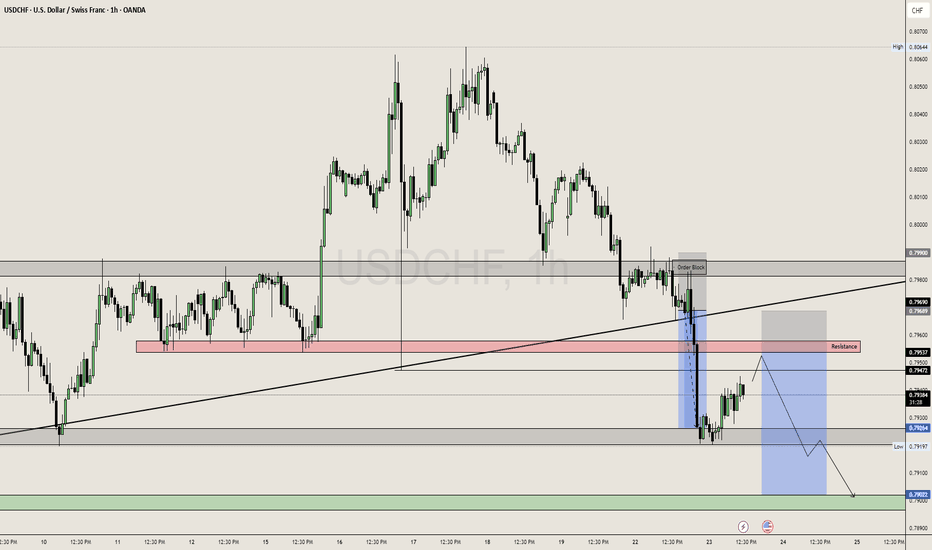
Yesterday USDCHF saw a waterfall movement after the DXY Losing Strength. We can also now expect a continue movement towards major support zone. We can plan our trade from the 1st Resistance Zone with 1:3 RRR. Looking good are for sell side movement from 0.79550. SL : 0.79700 TP : 0.79000 We can expect move in US Session. Sentiments are also towards downside as...
Gold Analysis on 4H Timeframe. Gold is at Major Resistance of 3450. We can Expect a sell movement from 3450 after sweeping the liquidity above, but in other case if closing happen above 3450 in 1D or 4H and Hold then we can Expect gold to test 3500 ATH. CMP: 3425 Resistance: 3450 Support: 3400 Demand Area: 3250 Supply Area: 3500 This Analysis if for Long Term...
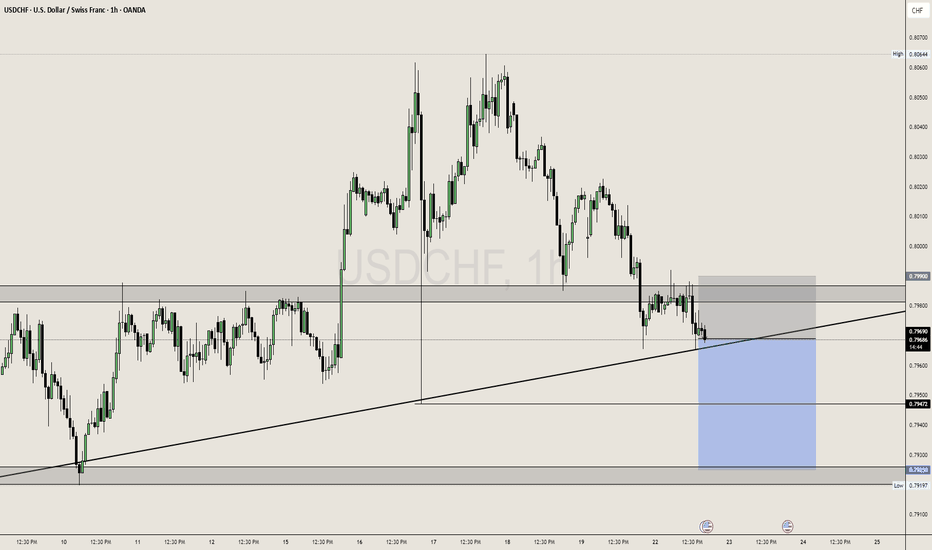
USDCHF Looking for sell side as it holding at trendline support. Safe Player go after breaking trendline and risky can look out for now before the US Session. Support Zone is 0.79200, We can expect a buy from that zone or Buys above 0.79900 after breaking and retesting the resistance.
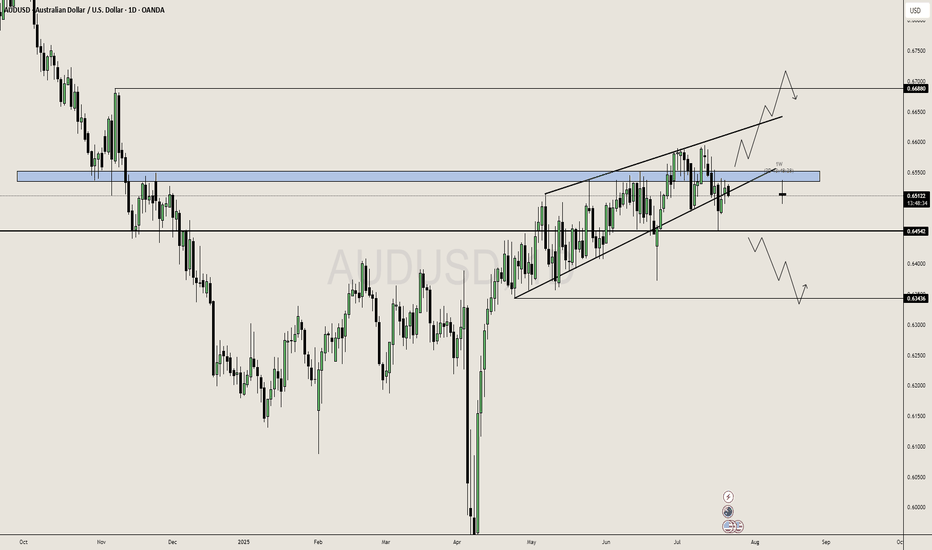
AUDUSD is still in Solid Sideways Range in Daily Chart. More Probabilities looking towards buy side, looking for liquidity at 0.66880. It's in Range since 18 April, 2025 and hunting liquidity for both the buyers and sellers. Possibly it could trap seller and go in Buy Side. In other case, The Sell Momentum can come if it breaks and holds below the 0.64500...
🏦 GBPUSD Analysis – June 17, 2025 | 1H Chart 🔻 Market Structure Overview Currently ranging between 1.3524 support and 1.3607 resistance. Price is inside a descending triangle – bearish structure. Clean rejections from descending trendline; each retest brings in lower highs. 🔍 Key Zones 🔴 Resistance (1.3580–1.3610) Multiple rejections + prior breaker...
🔻 Sell-Side Analysis – June 17, 2025 🧠 Context & Market Structure Price rejected major resistance around 3415–3448 zone. SL Hunt zone marked at mid-levels around 3400–3408, showing manipulation. Current price: ~3397, after bouncing from the Daily Flip (support) at ~3388. --- 📉 Bearish Case Setup 1. Distribution Pattern at the Top The upper resistance...
USDJPY Recently gave a fakeout of the triangle pattern in downside traping the seller, as trend is bullish and we see JPY is getting weaker. Now we can look for the Buy entry at retest of trend line.


