SlattYSL
PremiumWith all of the other pairs basically closing their gap against JPY, the only one left is usd!
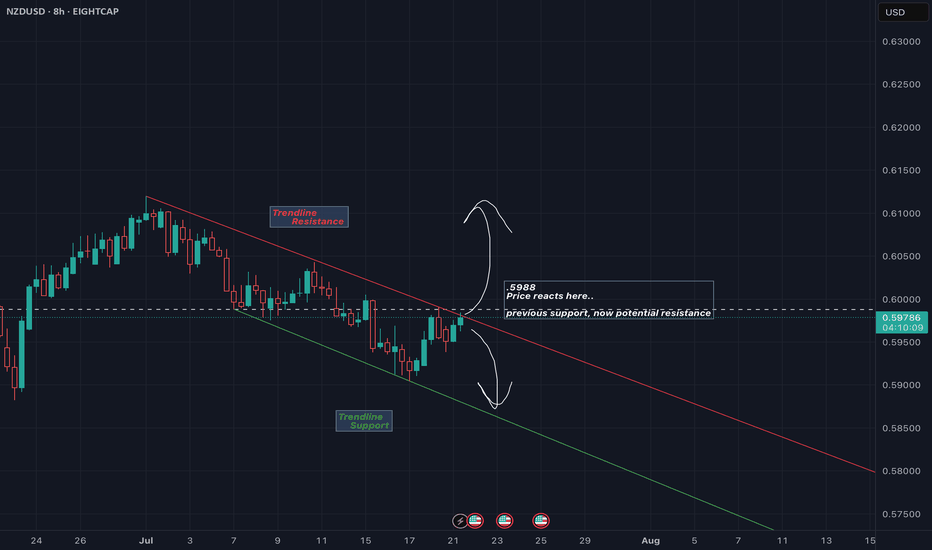
Nzd price within an 8hr channel. Either going to break out and become bullish (short term) or it may just fall back within the channel. Either movement should signal short term direction for the pair.
🔍 Analysis Summary: USDJPY has failed to close above 146.1 on the weekly for the past 13 candles, showing clear signs of price exhaustion at this level. Price has also tapped into a marked 8HR bearish order block and printed a Daily Pin Bar — a strong reversal signal indicating potential downside. 📍Key Technicals: • Resistance Holding: 146.1–146.6...
USDJPY touched 148 this morning ahead of US PMI. According to methodology 1. Resistance Zone: • The 0.125 level (147.820) acted as a resistance point where selling pressure overwhelmed buying pressure, causing the price to reverse downward. Since the price reached 148.000 (just above 147.820), it tested and failed to sustain above this level, reinforcing...
DISCLAIMER: This analysis is for educational and informational purposes only and does not constitute financial advice. I am not a licensed financial advisor or professional trader. Always do your own research and consult with a qualified financial professional before making any trading decisions. XRP is showing clear signs of weakness as price approaches the...
recent reports have suggested that inflation is moderating but remains sticky in key areas like services. If the data shows stronger-than-expected inflation, markets could respond negatively, with expectations of prolonged restrictive monetary policy. Conversely, a softer reading could boost market optimism and ease pressure on bond yields and the dollar....
It’s hard to see but I believe that’s an inverse on USDJPY 1HR. I had to go to JPYUSD to see if it actually looked like a head and shoulder. Looks like it can go back to 150.8 maybe 151.1 But today is NFP so I’m not sure if it can catapult with such news ahead. Here’s some insight. The US jobs market suffered a setback last month with the worst NFP reading in...
just simply rolling this widening trend to see how this plays out. I’m selling because it did not break the main structure (red and green). But it didn’t go down all the way. It tried to trend up until the mini structure was broken (blue). It retested the sell trend line so im just going to make an educated guess that it sells from here.
Cad is cappin. So, the Cad has been weak ever since their GDP came in lower than expected on Sept 29. They also printed 0% growth in October, so it's not a recession just yet because the trend is the same & not downward. ("The Canadian economy may have entered a technical recession, according to preliminary data from Statistics Canada, but experts say people may...
Looks like a short setting up. it topped out around .8945 & created a lower high around .894. Although that is slight, it is based on the hourly timeframe. just want to take this trade back down to the .5% retraction level on my fib scale.
just wanna see if I still got it. shorting audjpy. Seeing uptrend fake. All about timing in my eyes. educated guess.
if gbpjpy fails to close above the 162.7 resistance, then it's going to continue it's recency short bias
audjpy hasnt closed above 95.6 on a weekly level throughout this whole run. it's friday & pre london, i believe this pair is going to continue the trend of closing below 94.6 on the weekly level.
personally selling eurcad back into the downtrend. lot size and tp along the chart
audjpy hitting a resistance like no other, i believe we see sub 93.5 before we see a support, if any is there.


