Smaalgrom
A ETHEUR longterm weekly macd-evaluation seems to give a fairly indicative picture. After the MACD of this timeframe shifts towards lower levels the price does not fail to continue a significant set-back. Aproximate numbers, measured from the highest price before the arrow, to the lowest on the slope (errors may occure): Jul -17; 234€ (68%), Aug -17; 165 (50%),...
A followup on my previous post, with a larger picture. It seems that the .236 level might be holding, meaning the down-trend will soon continiue. If not, the next fib.- levels are at 319 € and 336, the last one i consider to be downtrend-breaker-indicator. We also see that the .5 level (336) resisted on the 17th, indicating that it was not possible to turn the...
The Ether-price went out of the triangle mentioned in my previous post, down to about 270€ shortly, as suggested. Now the question is if that was a retracement in the up-wards trend or if this is one in the down-trend. If the price makes a clear crossover of the fib. -0.5 level (at 301-302€), the upwards trend might still be alive. If not it still loks like short...
Expecting a bigger move to start soon, antime within the 5 next days. An idea about a short/medium-term targets would be: -If up, around 380 € derived from bollinger bands with base 50, on daily chart, and previous highs. -If down, my idea is around 270€ or 200€, based on earlier levels. As all know, theese are just shared thoughts, not predictions... But since...
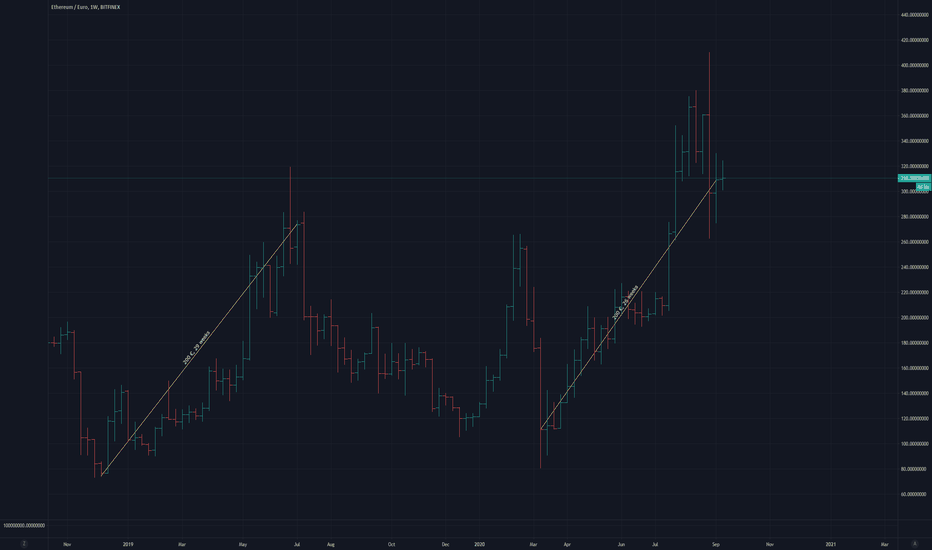
Weekly chart, bitfinex. Another observation: These two trend-lines starts at the close of the lowest bar on the downhill-slope and stops at the close of the first bar after the ultimate high of the last two longer bull-runs. Well, -Ultimate high of one of them at least. The second remains to see, because, after all, coincidences float around like jellyfish. The...
Ultimo 2017, M. Medio 2019. m. Medio 2020. m? The tailed M has been followed by bears before. Will it with bigger volume too?


