Speedrei-FRX
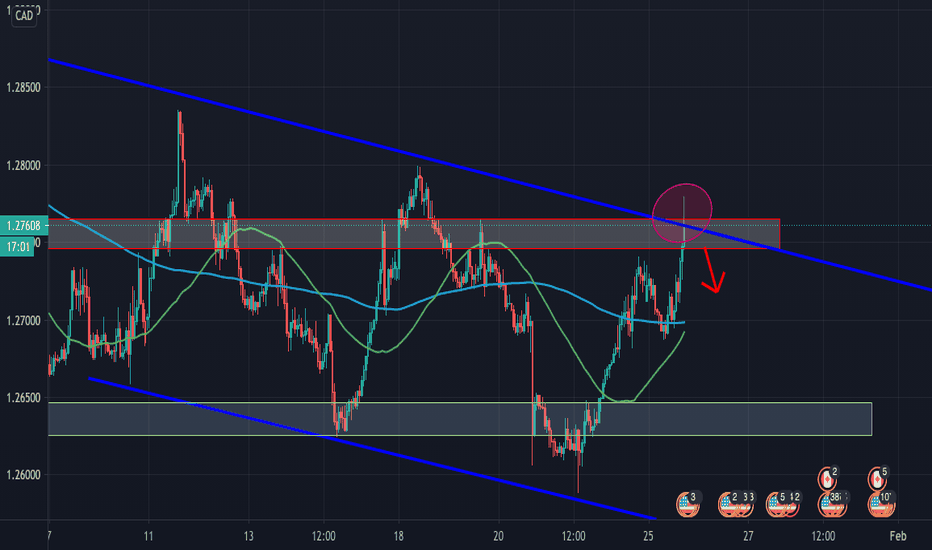
After multiple rejections on this trendline. we had a break and a pullback is forming ! The price will going down ? What is your thoughts about that ? Trade safely :)
Regarding to trendline. I think that the price will going down in few hours. Lets see :) trade safely.
As you can see the price is respecting the trendline on H1/H2. We can except a drop. On my last EURJPY analysis, the price respected the trendline. We'll take some profit again on it ? Dont forget to TRADE SAFELY !
As you can see on the chart, there's a long trendline over the long term. On the last H1 candle, EURJPY rejected this one. We can except a up for EURJPY. But we have to wait the end of the candle to open a position :)) Trade safely:)
As you can see on the h4/daily chart, eurusd is in a big support ! We can except the price to go up. Trade safely :)
GBPUSD is in a very strong resistance zone. I except the price to go down. Trade safely :)
If the price didnt broke the trendline at the end of the candle. I think that the price will go down
GBPUSD is in a strong resistance. I think that he's going down.
The price rejected a strong resistance. Can we expect to see the price going down ?
The price is respecting the trendline. As you can see on my last short trade the price went down.. Now we're excepting a buy.. TRADE SAFELY :)
The trendline is in good form to go in a long position ! As you can see in my last trade we want short. Now the price is rejecting ! safe trade :)
Beautiful trendline in H1/H4. i think that the price will go down..
We're in a beautiful trendline range in H1/H4. It will be nice if the price go down right now ! :)
It will be a great sell if the price is respecting the trendline :)
I'm going long for GBPJPY. As you can see there is a strong support, the price didnt broke the support for the moment and rejected it ! I'm going for a long ! What is your thoughts about this ?
The price is respecting the trend line. It'll be a reject again ? I think that it's a good possibility to enter after rejection :)
The price is going to a strong key point since 11th november the price is rejecting this zone. It'll be the same this time ?
I open a long position right now ! Safe trade


