SteveTan
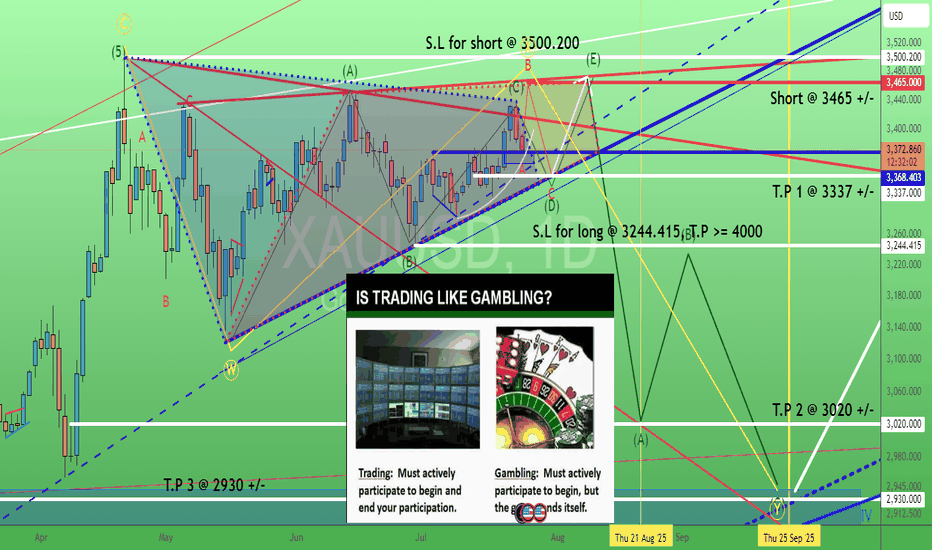
XAUUSD. are you betting (gambling) OR trading for bull/bear triangle? With or without "active lost/cut lost"?.. No stop lost = passive (cut) lost = Let the "gambling" games end for you. Not you end the "trading" any time actively. The "happy ending" always come with good risk management with good risk/reward ratio where ONLY happened when we have T.P and S.L plans.
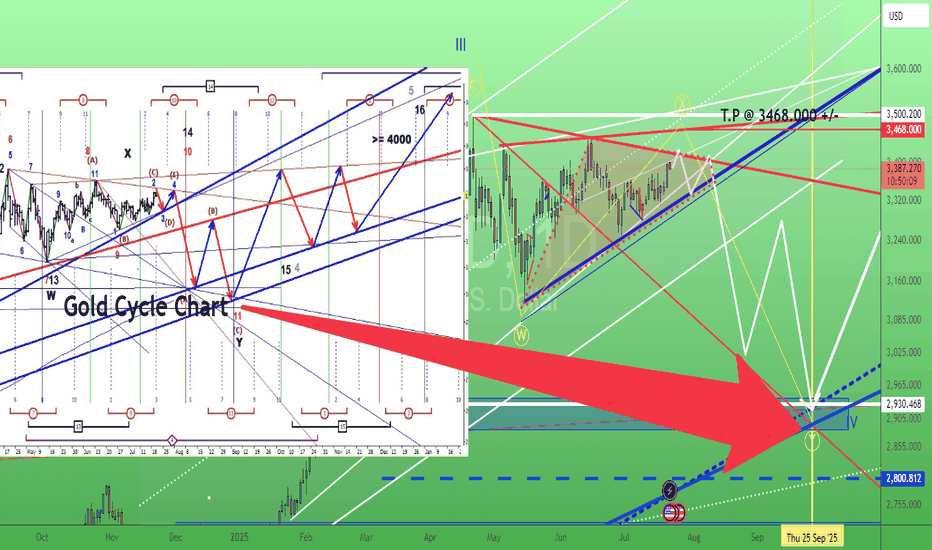
XAUUSD. is gold forming a bearish or bullish triangle, but the cycle chart shown it is pointing to the "south", maybe my analysis s is "wrong"...
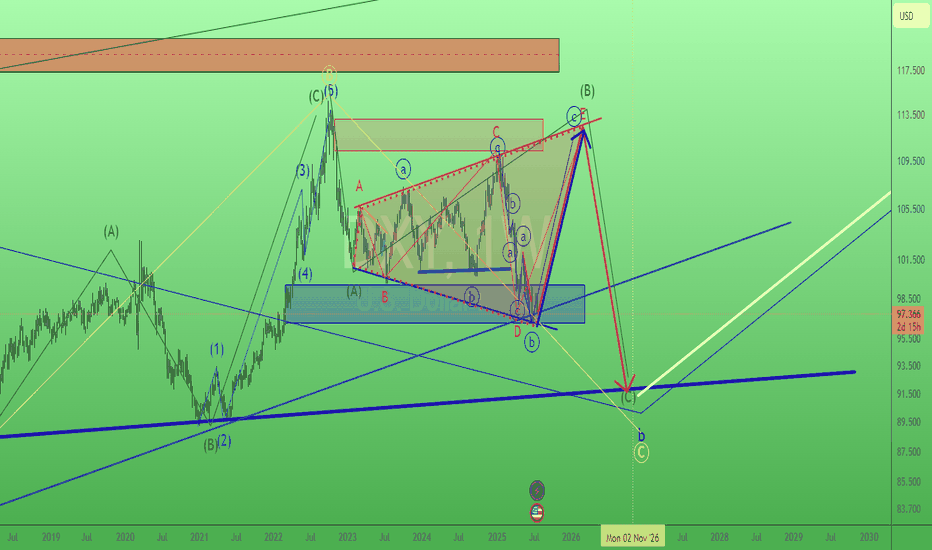
DXY. when Dollar = the king of cash said : "Cash is King!" AND as a King of cash I'm RECLAIMING MY CROWN.. What will happen to "all equities market? e.g Stocks, Gold or even Bitcoin?
XAUUSD probably still ranging within 3309 - 3368 before breakout to the upside...targeting still around 3460 +/-
XAUSD.. For the past I try to give as detailed as possible on my chart for learning purpose BUT end up fewer likes and "complicated" to understand comments.. I hope this time you are not getting signals only But nothings to learn...
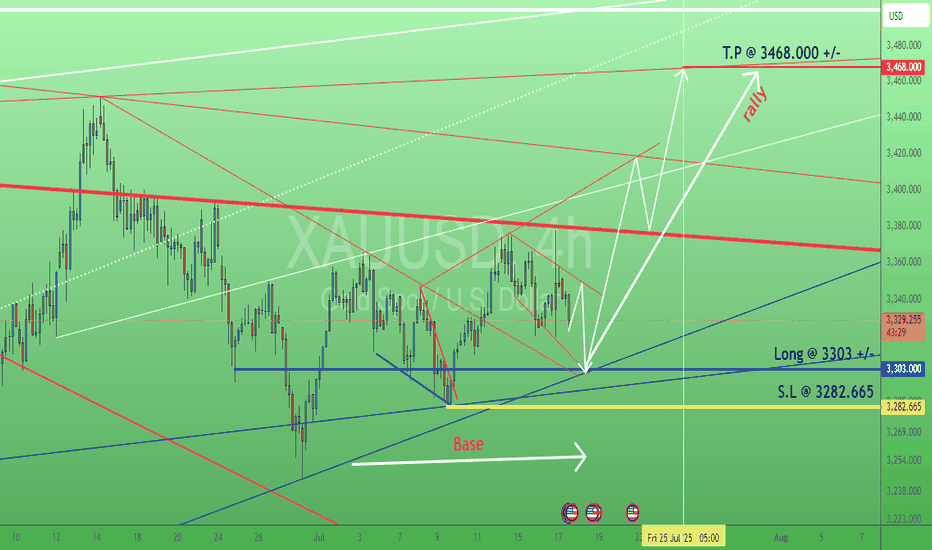
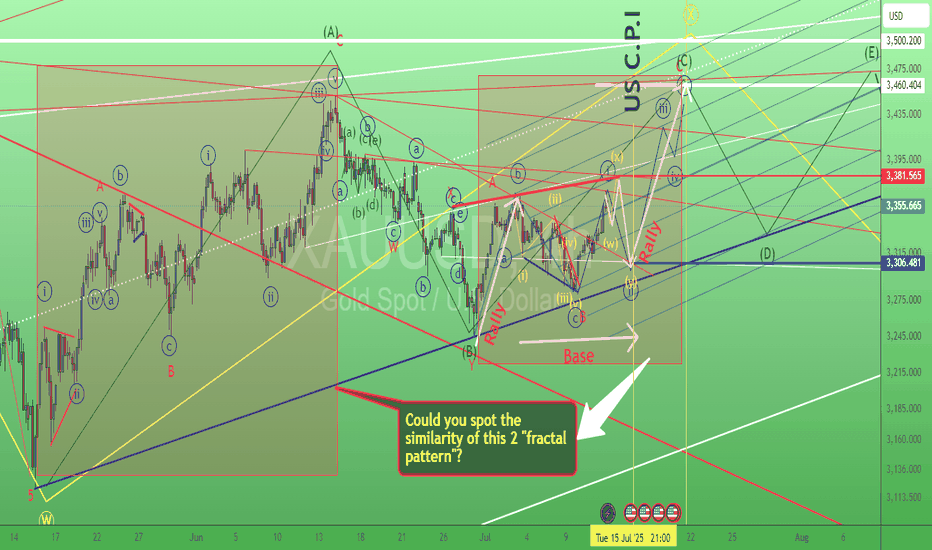
XAUUSD. Based on the latest "speed" development of chart instead of forming a triangle pattern gold probably building a "flat" "Base" before rallying toward 3460 +/- Coming Tuesday US CPI could be the "trigger" for launching the rocket..
XAUUSD. Based on latest 'speed' of chart "touching" those trendlines, gold probably having a triangle base now..before moving toward 3460 +/-...
SPX500 breaking ATH again are we in bullish stage? Or again Donald Trump "Inviting" us come to his WWE stage for his favourite "wrestling" games.. Jumping up and down or up side down.( expanding triangle) ......
XAUUSD,. based on how the "speed" of chart "touching" those trendline (white). Gold probably having a ( abc (blue circled) running flat waves) "base" before "rallying" toward 3428 +/-...
XAUUSD, will gold reach ATH soon or below 3000 first?.. Based on cycle analysis and wave structure 50-50, make your own trading decision...
XAUUSD having deep correction after "lower" CPI report as sentiment shift to only 0.25 base cut on next week.. which is not "catalytic" enough of for gold's substantial continuous uptrend as gold almost priced in all rate cut expectations now just waiting the amounts and frequent of base cut by THE FED.
XAUUSD possible forming a leading diagonal pattern = meant hitting ATH again @ 2568 +/- Which is the 1) monthly Pivot / R1 lvl 2) The Upper Resistance Line (red) of the pattern. Long @ 2498 which is 1) The lower Support Line (blue) of the pattern 2) Voulme Profile POC..
XAUUSD still inside 2530 - 2470 ( $60 ) range. While it need 100 Bucks to fuel the bulls. From 2460 toward 2560 or 2600?
XAUUSD probably resuming its intraday day uptrend approaching major resistance again at 2530 +- . Grabbing more buyer's "liquidity" before "smashing" its price below 2500 ( 2460 +/).
XAUUSD is still forming a complex double three wxy (blue circled ) wave pattern. Expecting more stop hunting occurred. Control our own risk as for any buy/sell orders as there is no confirmation for any swing low/high yet level.
XAUUSD's volume profile shape shown as "P" shape which typically interpreted as seller in control state.. PLUS Its price currently at trendline / supply / resistance zone
XAUUSD. Based on latest development of lower time frame wave structure, previous bearish triangle (a)(b)(c)((d)(e)(yellow) probably still working = The Bottom of gold could only happened at 2450 +/-
XAUUSD possible completed its expanding wave (a)(b)(c)(yellow) pattern. P/s We have to be "flexible" and "change" our view not just from e.g T.A / Eliott wave perspective from previous Triangle ideas as it was "invalidated" by "evolving" price as time passed.
