This seems very respectable hopefully the second half also does.
I just made this one. The other ones I made was from a diff price and angles.
I added a gann square. And it also looks good. I left everything else on too. Lmao
The gann time level I lined up and looks to be accurate in a few ways. Along with the price levels. And the speed fan looks nifty
My last post was an up close look at the speedfan and this one shows the whole gann square
It stayed in that one ring for quite sometime. And respect the fan levels really close
I made speed fans a while ago for this but I recently make a gann square and speed fan and mirrored it facing the other way for 2023
I saw speed fans and also saw a gann square back then. So I fitted it. It bounced off the golden lines nicely. And respected the fans and rings almost perfectly at times. I made this in like March-may
So with my last two posts I just left the two/“three” un hidden. What will happen outside the box? Any guesses
On my last message, this what what that chart originally was made from. I had the idea from Astro to put the speed fan from previous ATH to recent ATHs.
I made this a month ago. It was originally a fib speed resistance fan that I made with the ATH of 77$ and recent lows. Then I put a fan box then removed the speed fan. Then put a speed fan on previous low at the date of previous ATH then match the fans left sided with the ATH of 77$. That have perfect accuracy
FDX has seen some powerful moves lately. It has the opportunity to cross over on MAs and be super bullish.
In my last post i mistakes the spy for the SPX. the reason I think we are still at uncertainty is because there seems to be a debate between the government and investors about what the rate hikes should be. With only one more FOMC meeting before fall. This is why it seems accurate to me. Especially if investors get surprised by the numbers in September.
Looking at the spy right now looks like a fan would fit perfect. With more uncertainty ahead that could lead to more volatility. This could be accurate.
Before, I brought up the head and shoulder on the RSI for the 1D candles. Today it’s at 65.05 on the RSI. With super bullish being considered 65+ and the head of the rsi is at 85. There’s still room for it to run before the head and shoulder is out of the picture. There is a lot of hype about the short interest that still could drive in more buyers. With more...
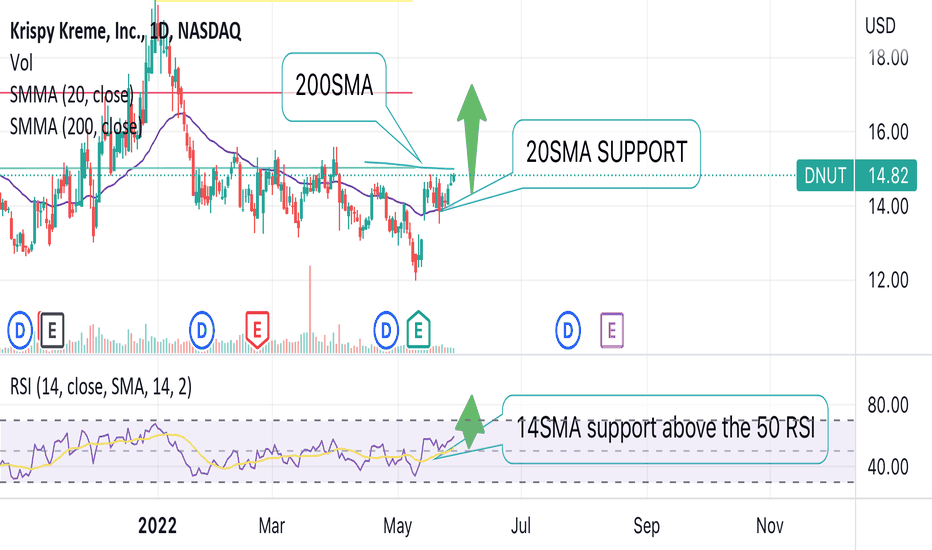
$DNUT has seen very good signs of strength from the support of the 20SMA. Also you’ll notice that the RSI Is holding above the 14SMA while it sits on top of the 50RSI. With this being a newer stock on the market and many years in business. We could see the company making expansive moves to catch the eyes of investors moving forward. I see a lot of potential in...
Today a 30% move was made to the 20MA. It also crossed over the 50RSI making the setup very bullish for tomorrow 5/26/2022


