Price began a recovery process to the upside since the beginning of this week. We should be completing wave 1/A pretty soon, and I´ll be looking for 2/B correction for long trades. Green support would be a very interesting spot for the correction. To the upside, there is strong resistance just below 0.64 (gray zone).
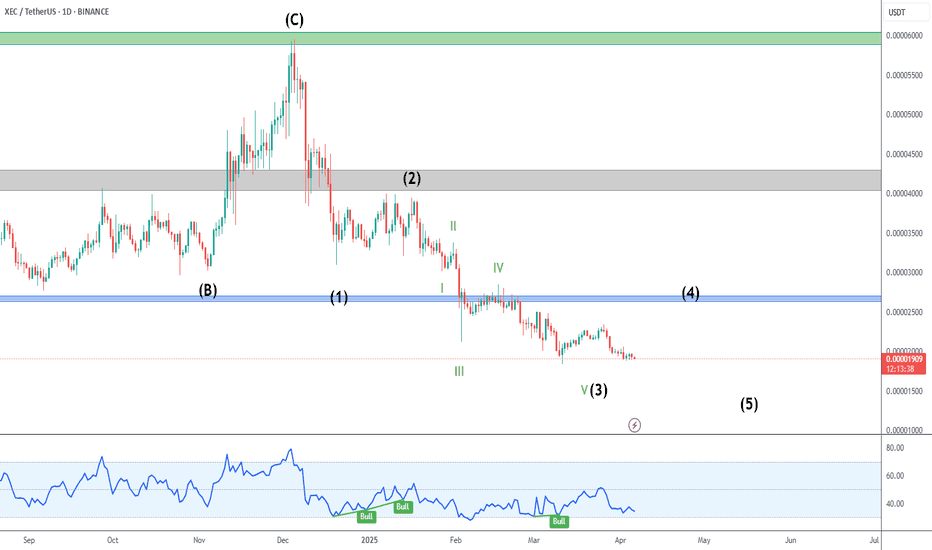
After the ABC correction shown in my previous analysis, we have a motive wave to the downside. I´m considering wave 1 to be an extended wave. Therefore, by EW parameters, we would have wave 3 shorter than 1, and wave 5 shorter than 3. Blue resistance is an probable target for wave 4.
Price keeps grinding to the downside, forming the green channel. A break of the channel should lead us first to a test of blue resistance, followed by gray resistance. Price is showing divergence in smaller timeframes, but this is not enough to consider a reversal.
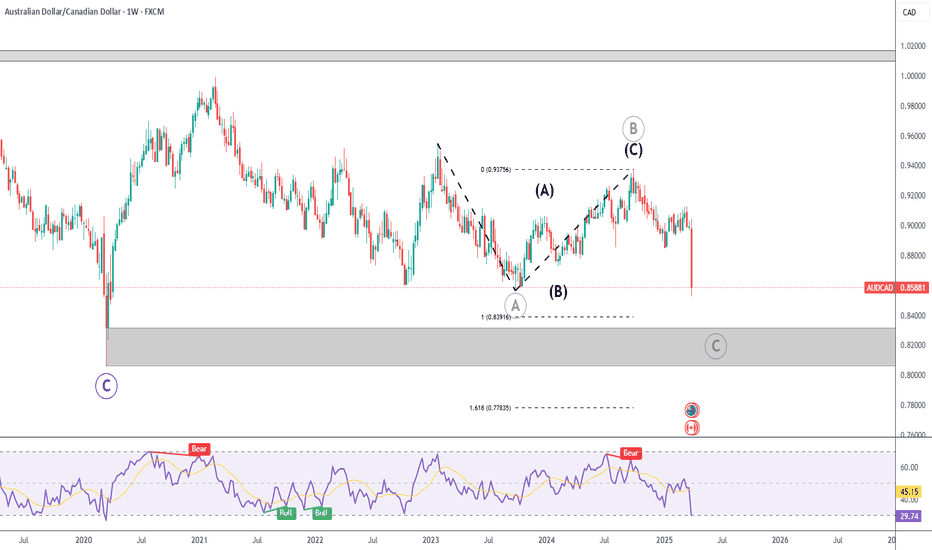
The upside correction I pointed out in my previous analysis finished (a little earlier than I expected), and there was a strong downside movement after Trump´s tariffs announcement. Next steps for price are: 1) 100% extension at 0.83916. 2) Strong supply zone (gray area) between 0.80 and 0.83. Until price reaches these levels, upside corrections are shorting...
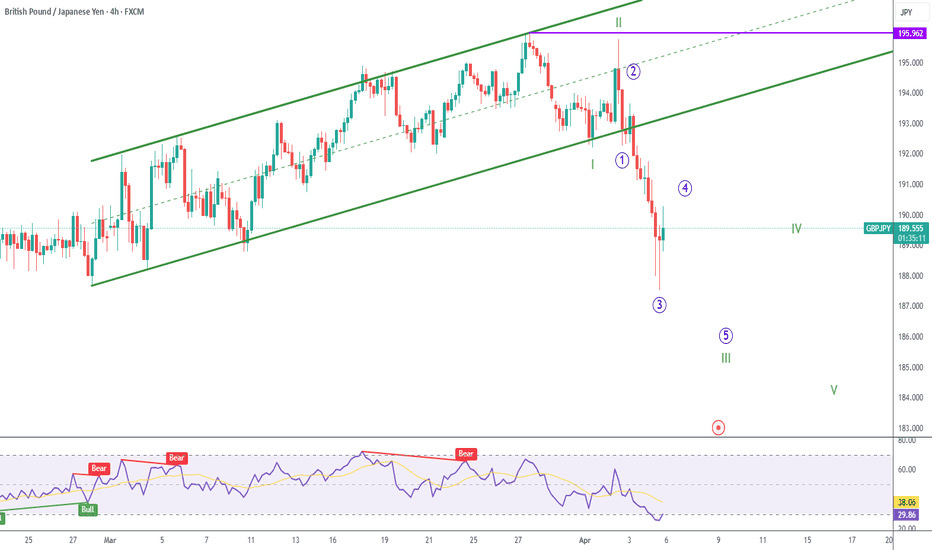
The ascending channel has been broken and we are in a motive wave to the downside. In my primary count, we are currently in blue 4 correction, and further legs to the downside are expected for green III and V.
In my primary count, I´m considering price is forming an ending diagonal, and currently in blue B of green V. I only see long trades for short term gains, or waiting for the diagonal to conclude for a short trade.
Correction is happening inside a clearly defined channel. Price found support at 61.8% pullback, with bullish divergence, which I´m currently labeling as 2/B. Although the top of the channel served as resistance, the higher probability is that the channel (bull flag) will be broken, and price will target new recent highs.
Price broke the black descending channel, in an impulsive (motive) wave, which I´m labeling 1 or A. There is also bullish divergence present in the March low. Corrections for 2/B are buying opportunities. There is very strong resistance just above 4.50, (gray area).
Price looks like it´ll go for a classic ABC pattern. This thesis is supported by bearish RSI divergence on the top, lack of divergence on the bottom, and impulsive/corrective patterns for A/B respectively. First target is 100% extension at 311.46.
Green IV correction is in its final stages, and I still expect further lows for green V / blue C. My first downside target is still gray resistance n the 195-200 zone.
The pair was rejected by strong gray resistance, with bearish RSI divergence. The ascending wedge (green trendlines), is also about to be broken. Higher probability is for another leg down, initially targeting recent lows around 101.
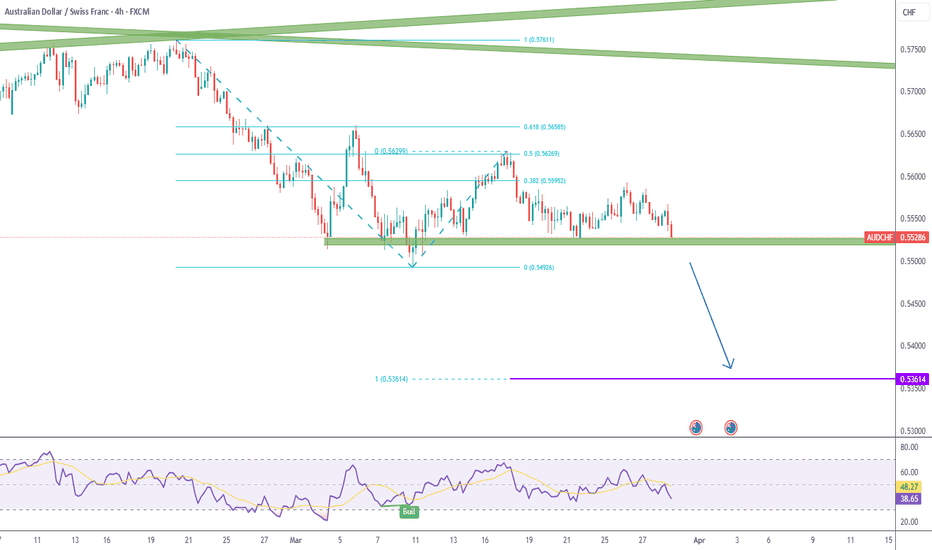
Price is being held by green support, but I believe it has a solid probability of being broken. This break could take us all the ways down to the 100% extension of the first leg down, around 0.53614 (purple line).
Price found support with divergence in the bottom trendline of the green descending channel for green V. The recovery effort found resistance at the green zone, which I´m considering to be wave a. Let´s see how the correction plays out (green b) for long trade opportunities.
For the next few weeks, I still expect BAC to make new lower lows, with the green zone just above 43 serving as resistance.
After the new low, bulls finally showed up and the green trendline was broken. I´m considering this to be the first leg to the upside (1 or A), and will be looking for longs after a correction (2 or B).
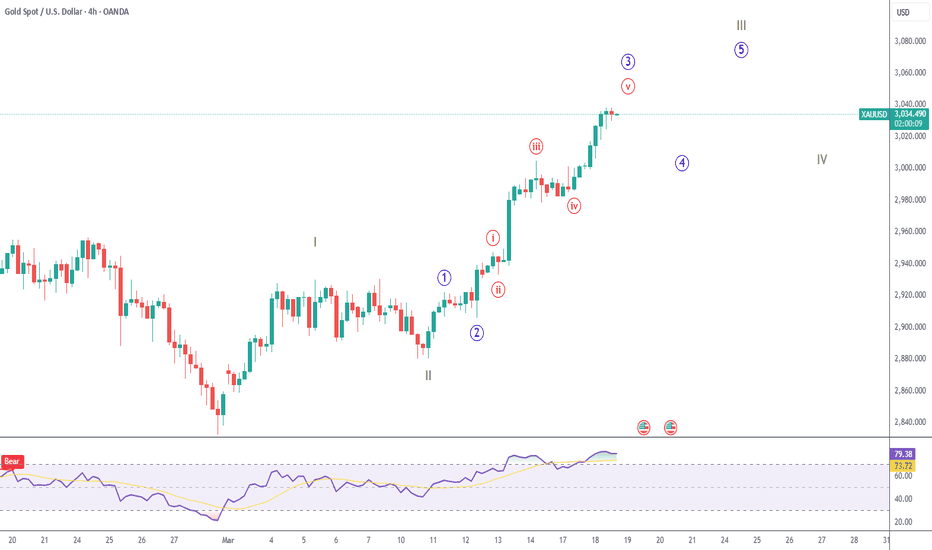
Gold´s rise doesn´t seem to be close to finished. In my primary count, we will soon finish blue 3 of green III. Pullbacks are buying opportunities.
The downtrend is losing strength, and we could be near the end of black C. RSI divergence has been present for the last month. A break of green resistance is a bullish signal. Gray resistance is a major hurdle for a continued upside.
The pair seems to be in the final stages of a 5-wave cycle to the upside (blue) 1-5. In my primary count, this will wrap up black C, and we would expect a corrective or impulsive move back to the downside. Right now, a break of green IV low (purple level), is my key to a reversal.


