Stoic-Trader
PremiumRipple could be repeating the triangle pattern made in black 3-4 in a larger scale, for gray 3-4. My primary count considers we're currently in black D. Note that the resolution of the triangle could take a while.
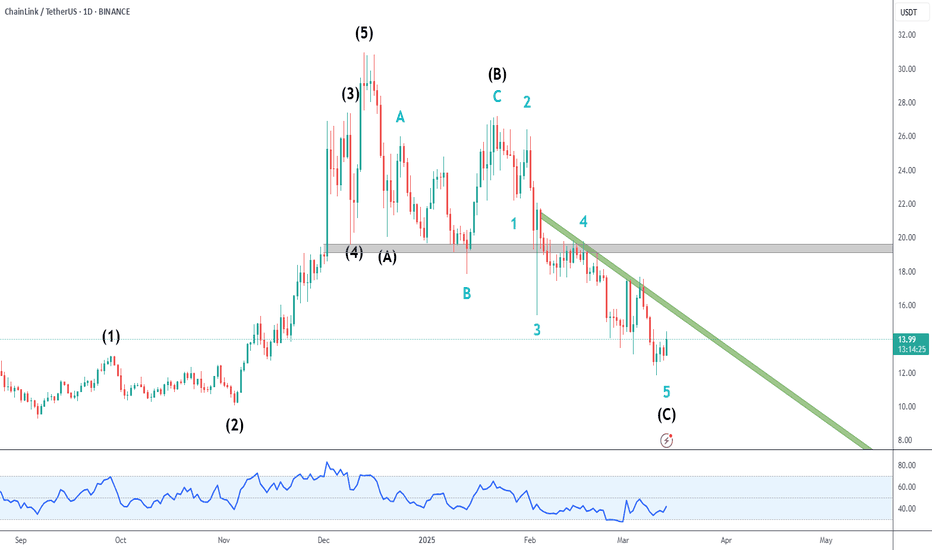
LINK is correcting the impulsive wave which began last September, and this correction could be in its final stages. Blue 5 / Black C is beginning to show divergence, which is a bullish indicator. But remember you don't trade divergence by itself. There is still no higher high and price has to face 2 hurdles: Green descending trendline Strong gray resistance...
On the Daily timeframe, we can see that a descending triangle pattern is being formed. Statistically, this pattern breaks more often to the downside, which aligns with my primary wave count. Let's wait for some resolution outside the triangle boundaries.
We have a short term reversal pattern in the 4H timeframe. A test of green support would be good for long trades Initial targets are the 2 blue resistance levels which match the 50% and 61.8% pullback levels.
After completing the 5 waves to the upside as shown in my previous analysis, Bitcoin went into full correction mode. In my primary count, we have finished Black A and are currently in Black B, which could retest 100k+ levels. Based on what happens on Black B we can have a better prediction for black C.
MKR is one of the better looking altcoins out there, currently correcting an impulsive wave which began early February. I'll be looking for long trades in smaller timeframes once price hits the 50% pullback. Strong gray resistance held price on the first try, but I believe it will be at least retested
Zooming out to the weekly chart, price action is tightening inside a triangle defined by the green trendlines. My bias is slightly bullish, due to the bullish RSI divergence, and the strong gray support zone. But there hasn't been an upside reversal in smaller timeframes yet, so I'm still keeping an eye on price movements.
We've fallen 70% from December highs, and the downtrend if beginning to show some weakness. Price is still grinding down, but we're touching oversold levels, and RSI divergence is starting to show up. Strong gray resistance could serve as the catalyst for a reversal. Key resistance levels shown in green.
Divergence on the high, no divergence on the low. Impulsive movement to the downside, correction to the upside inside a channel. You don't get much more bearflagish than this. But we're still inside the channel.. let's see how this plays out.
I've updated my wave count, since this large downtrend grind since early December is correcting the whole move up from August lows. We are currently in black C, and my primary count considers we still have one more leg down left before a recovery. Alternatively, if we see a break above gray resistance, my bias may change.
Following up on my previous analysis, the black ABC correction is clearer now. We're currently in wave C, which coudl target 0.00003685, the 100% extension of waves A-B (purple line). The hurdles to an upside reversal are: Green descending trendline. Blue resistance Gray resistance At this moment, I see no reason to be bullish.
There's a good shorting opportunity for APE right now, with a break and retest of the green ascending trendline and bearish divergence on the recent high. Targets are on the chart, with 2 levels for taking partial profits. Stop loss is just above the recent high which showed divergence.
In the 4H Chart, it looks like the ending diagonal (blue 1-5) has finished, with the break of the green descending trendline. Bullish follow-up would take to the 3 resistance levels shown in purple, at 0.50, 0.54 and 0.65. Invalidation is at 0.3858.
The continuous grind to the upside for BNB is typical of an ending diagonal, with wave 4 overlapping wave 1 in zigzag patterns. I am considering we are currently in blue B of black 5. A reversal to the upside below 616 (50% pullback), will be a long trade trigger.
For the next few days, I expect a recovery of oil price targeting blue resistance around 74.50 This is supported by: - Bullish RSI divergence in the recent low - No RSI divergence on the recent high - Break of green descending trendline.
Following up on my previous analysis, the downtrend is still strong, and I expect another leg down. The upside grind has the look and feel of a bear flag, and there is no RSI divergence on the recent low. The gray descending trendline could serve as resistance.
Zooming out to the 3-day chart, I believe we have finished the black 5-wave cycle and we're now in a correction. Even though the 50% pullback zone is about to be touched, it's a low probability that the correction will be so quick. Therefore, I'm considering this to be black A, and expect a sideways grind for the near future.
The strong downside doesn´t seem to be over, and the wrapping up of the green abc correction should lead us to fresh new los under 9.88. Red support could give us a correction to the upside on smaller timeframes, but I am considering this an opportunity for a short trade.


