Strength_in_numbers
Bullish divergence on the 15m and 1H chart 📈 Liquidity grabbed 📈 Expecting a small move up = 1.6% Long scalp trade if youre interested
Where is XRP next likely to head next? $2.65 is the next price level down with 4 points of contact. This level was also a weekly high as well as the 0.5 fibbonachi. Next level down is $2.34 with 6 points of contact. There is a downtrend forming so a breakout of this trend could be bullish for XRP 📈
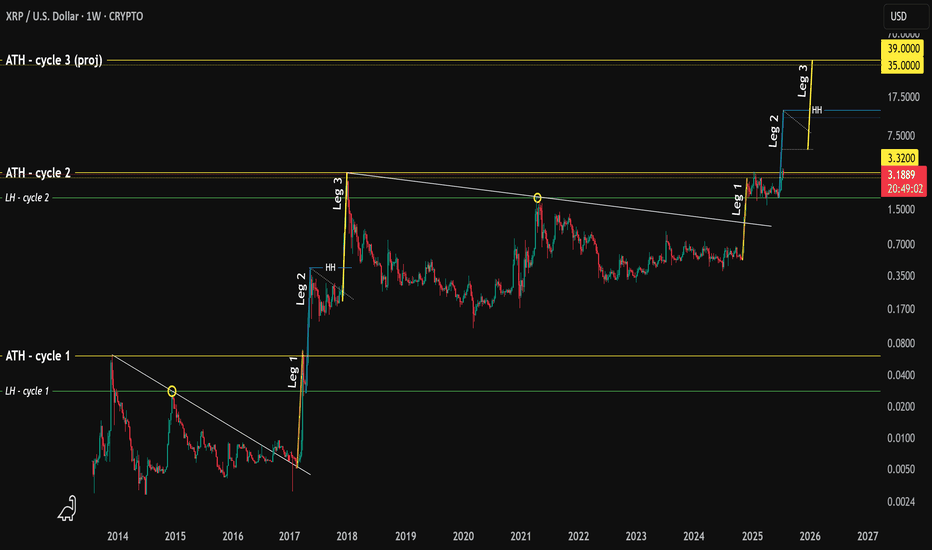
Hello. I'm going to walk you through what happened in the early years of XRP p.a. and how this fractal might play out today. Here's what happened. 1. A high was printed in 2013 (ATH) 2. Followed by a lower high (LH) 3. XRP broke out of a downtrend 📈 4. In 2017 price increased 1,280% finding resistance @ ATH (we'll call this "Leg 1") 5. The LH then acted as...
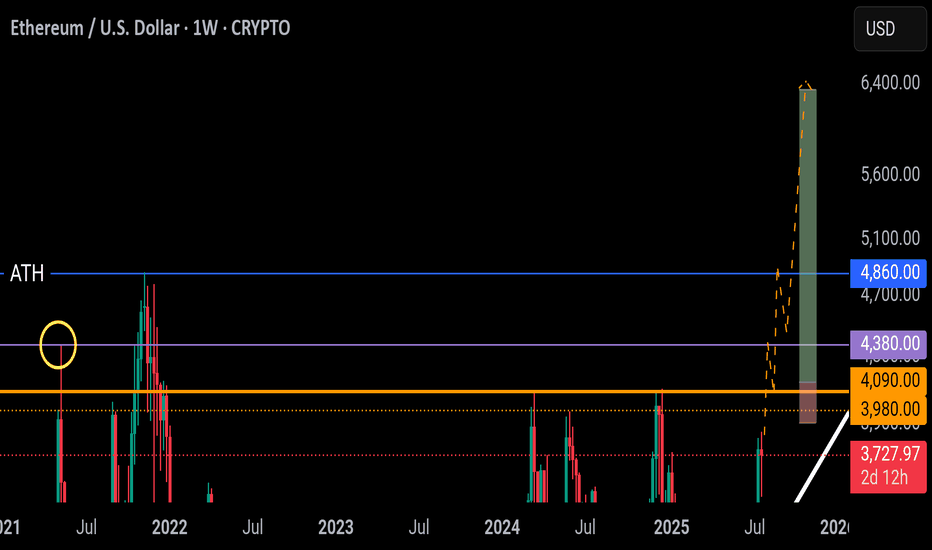
Resistance zone @ 4,000 - 4,100 If Ethereum is able to break above this level the next price level likely to slow momentum / see a rejection is @ 4,400. A rejection from this price point could present a good long entry at the same Resistance zone @ 4k (flipping into support). The ATH is likely to briefly act as resistance - saw a similar pattern with...
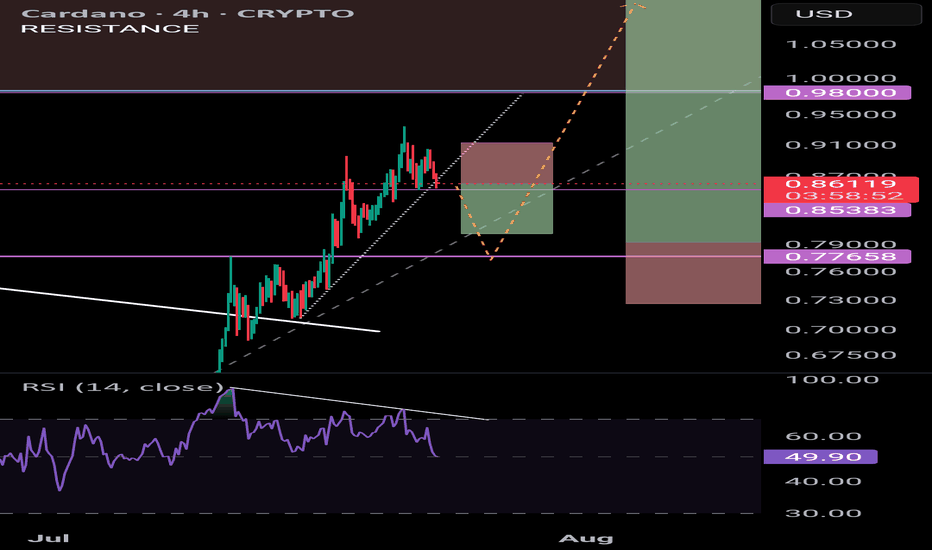
If ADA breaks below 0.85 I believe the next level of support will be @ 0.78 - this price level acted as resistance and was the Weekly high on 3 x occassions. Thus it is assumed that resistance will flip into support. Bearish div. Suggests a move down as well as a break in the uptrend. Entry @ 0.79 TP 1: 1.13 TP2: 1.43 TP3: 2.00 You could take a small short...
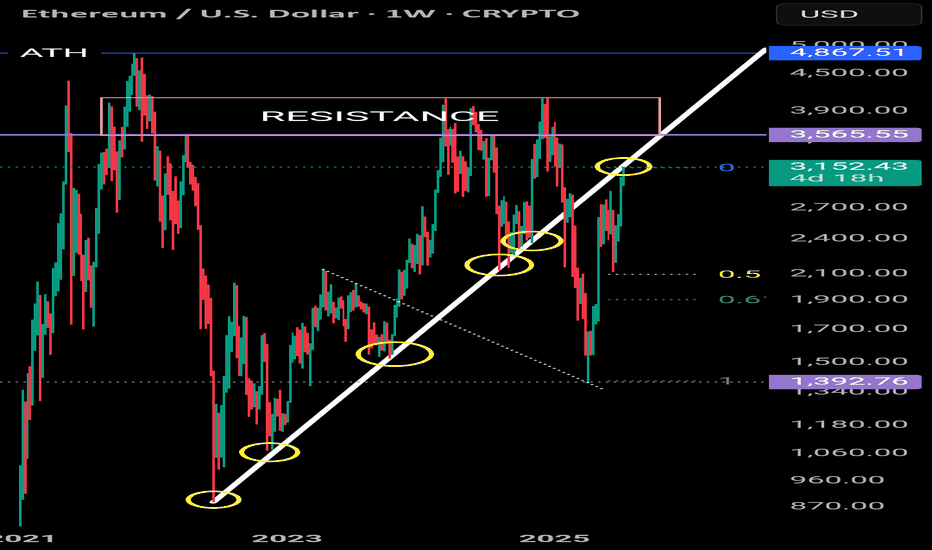
Ethereum is perfectly touching a macro uptrend (5 touches acting as Support). Price has recently rallied but is currently pausing for breath. Could the uptrend begin to act as resistance? A break above this line would invalidate this thesis. Equally there is a huge resistance zone @ 3,550 - 4,100 And then there is the ATH So there are a few hurdles in the way of...
1D timeframe. There are 2 signs that the price of Bitcoin is about to explode: 1. We have broken above the ATH 2. BTC peaks Nov-Dec in historical halving cycles 2013/2017/2021 And there are 2 paths that could play out. 1. Great. BTC has touched an uptrend (white line with 3 x red crosses). A break above this uptrend + a weekly candle close above 110K could...
1W timeframe Finding weekly support @ 0.26 Historical resistance in the 1.24 - 1.93 price range. Set TP @ 1.03 Easy 200% Downside potential -27% Not a "monster/moon" coin but really clear support / resistance levels. Get in and get out 📈
1D timeframe MASK is currently re-testing the downtrend. Breaks above could send price to 5.30 which has acted as resistance 4 x times historically. We did see a fake-out of the downtrend before a significant move to the downside bringing us back underneath and back to previous support levels. Wouldn't be suprised if we re-tested 1.30 as support before going...
1D timeframe Bullish divergence Entry around the 618 fib Targets rely on a breakout of 2 x downtrends Entry: 0.0196 TP1: 0.0288 (+47%) TP2: 0.0375 (+91%) TP3: 0.0480 (+138%) SL: 0.0173 (-13%) R:R - 10:1
4H A break below the uptrend (white line) could result in a move down to 103,400 📉 which would fill a Fair-value-gap and grab liquidity. Short position: -3% vs +1% 2.3:1 Reward to Risk
Weekly TF Ideal buy range $0.01 - 0.03 Risk = -50% Reward = + 4,000% (assumes ATH as TP level)
Hello 👋 Weekly TF Bearish divergence currently playing out. Observing the uptrend (dotted white line) we did see a brief break below this trendline in April. Another break could result in a correction to 67.5K - 69.9K price range which is the 618 fib and an area where price found resistance on multiple occassions. Bitcoin has found support on the Weekly RSI @ 45...
Daily TF Key level @ 0.73 Breaks above this level and the downtrend would send Cardano to 0.98 With mega-bullish target @ 2.20 - 2.40 price range. 5 touches @ 1.15 - 1.17 range which could be another Take-profit zone enroute. I think also a hedge-short bet at this level could work as a separate trade. If we fail to break above 0.73 I believe the next natural...
4H timeframe Inverted chart Looking at a short entry @ 107,000. 618 fib @ 107,400 Liquidity Zone @ 107,000 - 107,600 Take profit approx 98,000 This move would fill a Fair Value Gap a grab liquidity in the 98,000 - 100,000 price range. Retracement worth - 7.7% from entry.
Weekly TF @ 618 = 0.180 - 0.205 price range. Would treat this as a long trade with low lvg. 50% up vs 15% down. @ 786 = 0.05 - 0.07 price range. Spot buy. 11,000% (to ATH) up vs 37% down. Weekly RSI moving to oversold would be a good buy signal.
4H TF *chart inverted Observing a trendline break - next leg down would be 98k (-6% retracement)
Weekly TF Chart inverted Looking at this chart - what would you do here? Kaspa has been unable to exceed the $0.19 - 0.20 high. And has broken below 2 x key trend lines. I seem to be missing some historical data on this chart but if we use the lowest price point and use a fibbonahi retracement tool, the 0.5 puts is roughly $0.010 - 0.012. Equal to a 80-90%...


