Sully-X
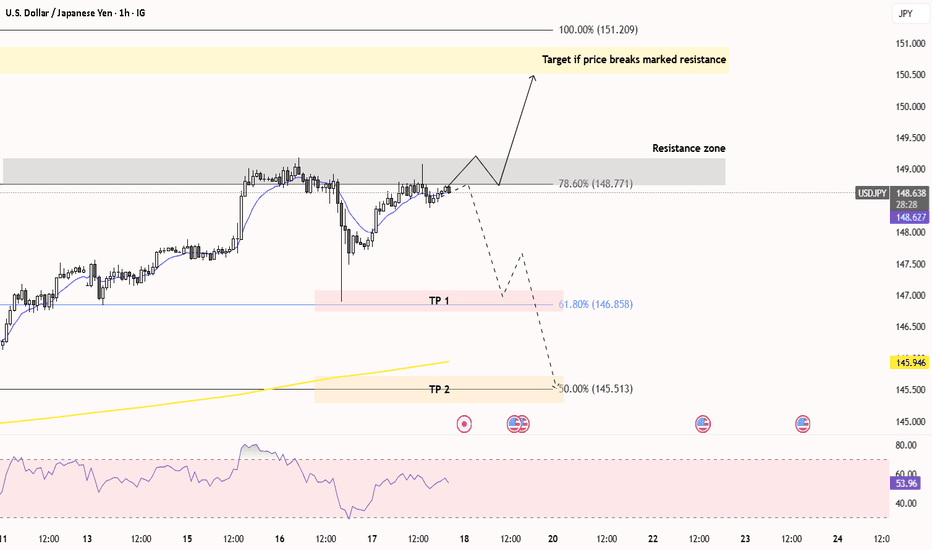
EssentialAlright Traders, Here's my breakdown of USD/JPY's next moves: The price has been repeatedly testing a strong resistance zone (those areas I've highlighted). It's really trying to push through, but this resistance is holding firm. Here's the game plan: If price successfully breaks above this resistance, we could see a strong bull run. My target for this move...
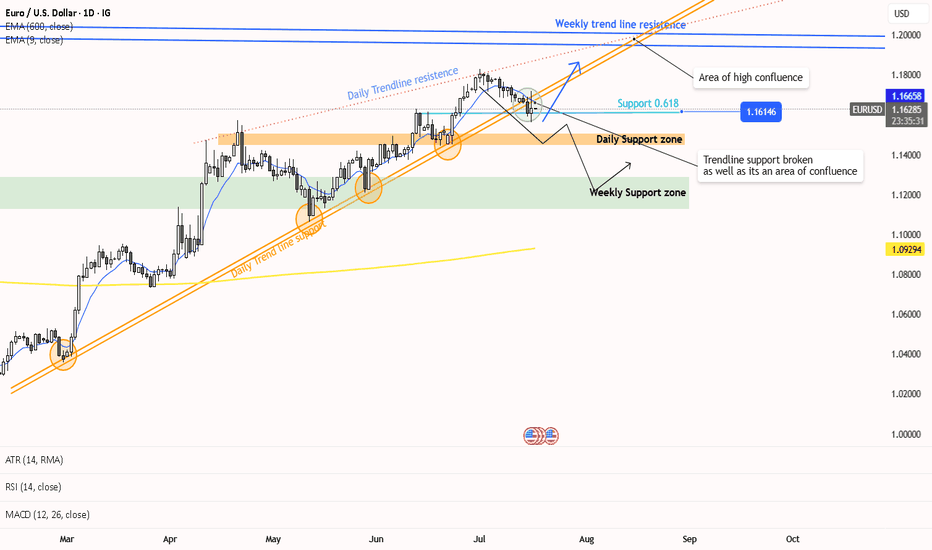
Alright Traders, Looking at the charts, it seems price just broke below a really strong trend line support – that line held up multiple times (you can see the circled spots!). Now, the big question is: Is this just a quick dip (a pullback) in our current uptrend, or is this the end of the uptrend altogether? If the price holds up at the 1.16146 support level,...
Hello Traders, Gold is forming an ascending triangle and whenever price gets to the trend line support we get to see a strong upward movement. According to this technical analysis it is highly probable that gold is going for trend line resistance at $3440. This analysis is purely technical and does not contain any fundamental aspect.
Hello traders, Just sharing my idea of what might happen next based on the recent price movement. After a long downtrend this pair started gaining strength after April 2025 and formed a symmetrical triangle. We can clearly see the breakout on 9 July 2025. Will this breakout continue ? Well, its about to touch the 200 Ema only than we can confirm if the bullish...
Hello Traders, Falling wedges can be seen in Eurusd chart and price is expected to breakout. Wait for the price to break 1.17229 to go long or if it breaks below 1.1629 consider short. This analysis is solely based on chart patterns and some indicators like MACD, RSI and Moving Averages.
Hello Traders, Let's talk about Gold. Here is what I see for its next moves. I use these tools to help me: EMA (Exponential Moving Average) Fib Ret. & Ext. (Fibonacci Retracement and Extension) VWAP (Volume Weighted Average Price) Volume Profile RSI (Relative Strength Index) Looking at the big picture, it looks bullish for Gold. I see an inverse head and...
Hello Traders, This whole analysis is based on 1 hour time frame. Indicators used for technical analysis: EMA RSI VWAP anchor Volume Profile Fibonacci retracement and extension In 1 hour time frame price is forming an ascending triangle which is likely to break out as EMA, and vwap are signalling bullish momentum. If price breaks resistance at $1.17832 its...


