Not a lot of people interested to sell at the latest weekly resistance around 300. Not expecting there will be a lot of selling pressure at the next daily resistance around 360. It will more likely act as consolidation zone before the next leg up. 400 resistance is another story...
What I'm watching at the moment. Others are probably watching it as well. ETH was leading the way up to now and consolidating above weekly support.
Up to now it is the case and a lot of people will be afraid to buy/long because of that. Expecting a second leg down to 8000 weekly support zone before halving. Anyway, only the bots know for sure.
With SPX chilling just above weekly support... ... expecting BTC to have some room to breathe for a few hours. So some upward movements towards .5 and .618 Fib levels are on my roadmap.
Impressive dump that I didn't expect with such a velocity. Feeling like an overshot out of range at the moment. Short term, still thinking we'll head back towards middle of the range. Having a look at Fear & Greed Index reinforces my biais. alternative.me
Expecting a retest of the 7097 resistance then back down around 6765 daily support. Wouldn't be surprised we'll overshoot to the lower band around 6685. But keeping in mind it's weekend and bots might have another plan...
CME gaps have a tendency to fill. Latest one is not so far. Expecting CME Boys to push price up. Until then bots keeping price sideways and stop hunting. Gap zone bottom around .618 Fib as well.
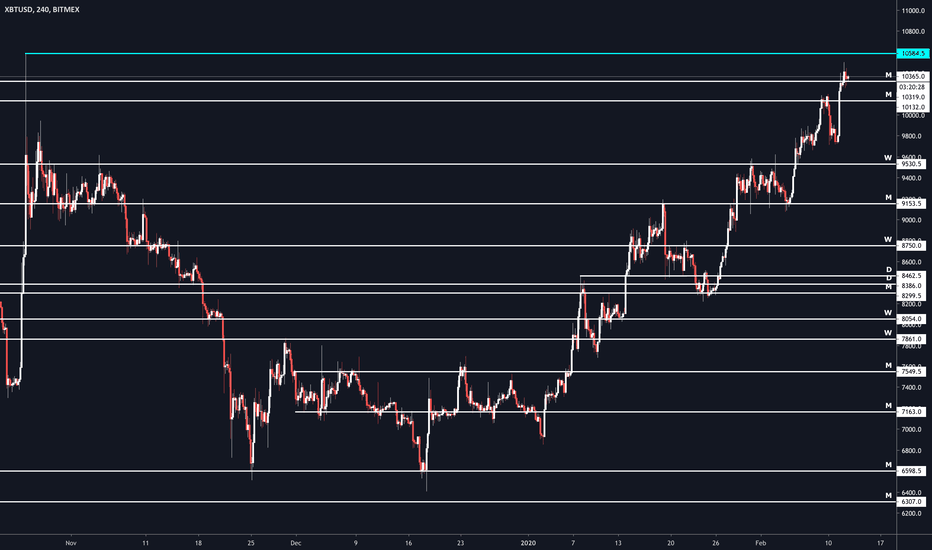
Squeezed in between monthly supports and supported by the .618 pitchfork line. Really think the bulls will try another attempt to reach that liquidity pool above 10500 to trigger all the stop losses and market buys. It that's the case, expecting a spike to next HVN zone between 11300 and 11700. If not, retrace to weekly support at 9500.
Wondering if there is really a lot of stop losses above 10500... Looks like we are slowly crawling towards it and we should discover it soon.
The fact that we did not break out of the red box added to the fact it is weekend... makes me think there is a high probability for the bots to draw that famous Bart pattern at some point...
Hard to say what will happen from this point. One pattern we could draw is an ascending triangle. Decreasing volume is an indication that this could actually be an accumulation phase before a breakout to the upside. But RSI is showing us a divergence.
Price at HVN at the moment and back in the trading range. Looks like momentum is back with the bulls for now. Next target is the weekly resistance at 9500.
Looks like momentum will push us higher. Expecting some kind of retrace first though. Yellow is the 21 SMA, blue the 200 SMA.
Decreasing volume... Decreasing RSI... But 2 CME gaps to fill below... It does look like a bull flag, but it feels like we'll swing lower first.
Just broke out of descending triangle. Could still be a fakeout though. If not, we'll probably head for monthly resistance at 9250 which I'm not sure will be strong enough to block the way to 10'000 region where we have stronger monthly resistance.
The weekly support around the 8000 zone has been tested several times during the weekend. Selling pressure looks stronger at the moment. Looks like we might revisit lower prices.
Looks like the price range for the weekend has been defined. Unless the bots have something else in mind. Pick your trades carefully as weekends are usually Game of Bots.


