Gold price broke down support and approached support retest in an ascending Wedge which is also a Bearish sign indicating further bear or dump, from which I took the short Trade.
As I stated yesterday after price rejected from the Diagnonal resistance, I said price could retest and dump further or breakout to higher levels. I did ioen a short for the dump, but then I checked the trade this morning and realized it's in a breakout trend. So I closed the short in a small los and capitalized on the long at the point of resting the Trendline...
Silver price after falling from the ascending channel last week took a straight dump in a closing descending channel and seemed to take support from the purple minor zone from which I took the long trade which is still running. Also formed a double bottom and broke out the diagonal Trendline resistance indicating more bullish Signs.
Crude OIL price broke above the diagonal Trendline resistance flipping to support from which I placed a long trade to the Higher TF major resistance. Price Action moved exactly as I predicted just missing my entry price by a few cents 😂 and hitting the set TP (it's part of the Trading Game😅). As we can see currently price has rejected well from the Major...
After closing the Short at Break Even, I wait for price to reach and hold from the now support and opened a long position of which went better than planned. _ THE _ KLASSIC _ TRADER_.
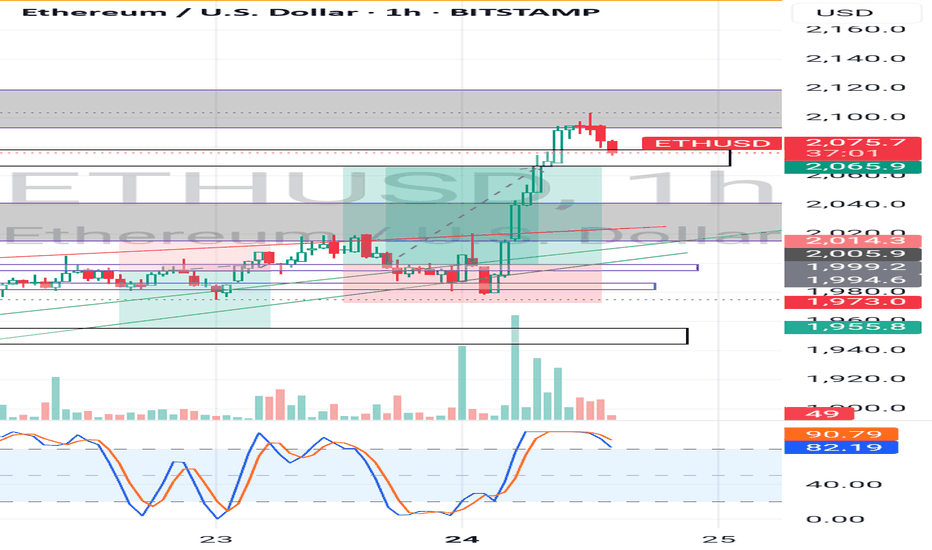
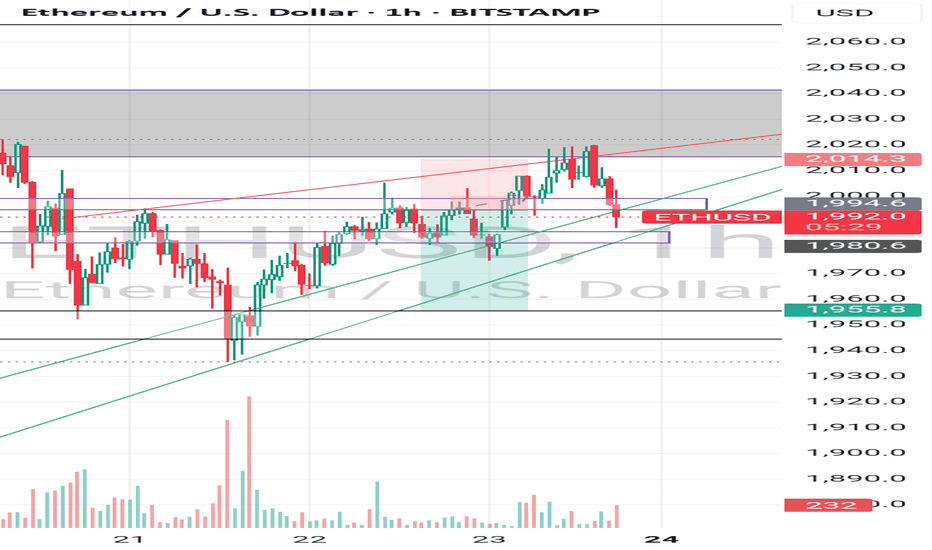
Ethereum later held support from our diagonal Support Trendlines and took a minor bounce. Though I closed at Break Even, price moved to sl and currently still hasn't decided on a direction to Take.
Ethereum price has been choppy and low in volume since it's major dump during the week. And still can't get passed the minor resistance zone, from which I'm capitalizing on to the next major Support in confluence with the diagonal Support Trendlines. So let's see how price moves. The_KLASSIC_TRADER.
Cruse oil price has been choppy and moving randomly lately especially with Trump's Tarrifs and updates. But I say the break from the ascending wedge and hold horizontal support zone area and price seemed to be heading to diagonal and horizontal resistance which I set our TP at and boom. Klassic_Trader.
Theta Price has formed a Rising wedge pattern both in 1HTF & 4HTF which is a strong sign of Bullish Momentum building. Although in DTF it's a falling channel ranging, but a strong breakout from the ascending Wedges may also indicate a trend reversal to new levels. But in the main time, this is our setup.
A quick scalp, using Support and resistance. In the long term price is still very Bullish though.
The British Pound formed a falling wedge pattern (which is a bullish Pattern) as it was heading down towards our strong Support which is bullish Pattern which is a double confluence for upward Momentum and I took the set-up accordingly, and we can see it moved exactly in our direction and TP. Klassic_Trader.
Silver price has been in an upward Consolidation movement holding support especially, and when I saw the support breakdown from the minor channel I decided to capitalize on it and took a short to the very next support which moved as predicted. Klassic_Trader.
Gold took and followed my Green Path prediction from yesterday, meaning we're very much bullish in Gold and confirming the uptrend to $2950 zone
Gold is in third wave of the ABC correction pattern, and also in a major expanding triangle pattern, which is a major bullish Pattern meaning GOLD is still going for new highs in the coming weeks. Also meaning the ABC pattern might go further into a 5-Wave (ABCDE). But like I always say, we'll see how it all plays out in the coming days and weeks. The_Klassic_Trader.
Currently what I'm seeing on Gold Price Action. Overall Gold is still Bullish. But at the moment the price is still in consolidation, and below my 4HTF Resistance Trendline, but the price is forming a bullish rally due to the collected liquidity in the Asian session. The local pattern “double bottom” is formed (false breakdown of support) and the next target is...
Gu price Action has been in an overall bullish trend, and breaking down the ascending channel twice I taught it was going to dump, but bulls held up strong at the support from which I took the long trade.
After BTC brokedown both support Trendlines I waited for a good zone of resistance and entered the short position and as we can see it went good as planned.
The British Pound has seen a strong uptrend since the release if the news, and just at the breakdown of thie previous channel I noticed price still moving in the uptrend and Bullish Momentum.


