TSI_Analytics
On the daily chart of USDPLN, the price has started a new downtrend. We expect the price to go lower within the fifth Elliott wave of down period.
The price of NEOBTC has reached the 65.8% Fibo level of previous third wave, wich can indicate the end of the 4th wave. Taking this into account, we can expect the 5th wave to start. The price close above EMA100 and psycological level of 0.010000 can trigger a bullish impulse. This movement can be described as a sub wave of the global 5th wave, the target for...
On the daily chart of LTCUSD, the price with high probability is at the end of the 4th Elliott wave of up period. Also, there was a fractal breakout which can cause a bullish trend start/
On the daily chart of ADAUSD, the price is about to start a new bullish trend after Awesome Oscillator indicator divergence. Also, a buy signal is forming - "AO Cross".
On the daily chart of EOSBTC, we expect the price to start the 5th Elliott wave of a "bullish" period. Breakout of Larry Williams` signal is our buy level
On the daily chart of XRPBTC, the price with high probability will start the 5th Elliott wave of a bullish period after AO indicator divergence.
ZECBTC has met support at level 0.02600. Here also was a first up impulse on H2 chart. Our buy signal would be price close above EMA 100.
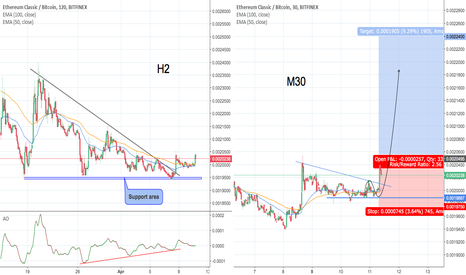
Level 0.0019500 is a significant support level for the asset. On the timeframe M30, a breakdown of the inclined resistance level occurred
On the daily chart the price is in a steady downtrend with recently formed bearish push signal. Our target - the C wave of upward Elliott waves cycle.
On the H4 chart of IOTBTC, there was a strong bullish wave and, afterward, correction to 61.8 Fibo level. Breakout of the fractal level of 25.03.2018 is our buy level.
The price chart has reached the Fibo level of 61.8%, so we expect the fourth wave to end and start the fifth one . Breakout of the resistance zone marked by red line and price close above EMA15 and EMA35 would be an optimal signal to open long. Target level for movement in the context of the fifth wave may be 0.00001182 - 0.00001260 .
A downward correction on the H2 timeframe shows signs of slowing down. Breakdown of oblique resistance - a signal to buy
On the daily chart of VENBTC, the price, with high probability, is at the end of the 4th Elliott wave of up period. Also, there is an AO divergence with buy trading signal - "two peaks".
On the daily chart of XLMBTC, the price is changing the trend direction into a bullish one within a beginning of the 5th Elliott wave of up period. Also, a buy signal is forming - AO indicator cross, a breakout of its level will be our buy entry.
On the daily chart of XVGBTC, the price has started a new uptrend and formed a bullish fractal level outside of Alligator indicator MAs. Breakout of its level is our buy signal.
On the hourly chart of USDSGD, the price has started a new downtrend and formed a sell fractal within a beginning of the 5th Elliott wave.
On the M30 chart of EURJPY, the price has started a new downtrend within wave C of ABC zigzag. We recommend selling the instrument if the price breaks the fractal level.


