Tami512
🔍 Executive Summary Gold (XAU/USD) continues to hold firm above the $3,370 handle, supported by a bullish macro narrative and confirmed technical structure on the 4-hour chart. Amid dovish expectations from the Fed and soft labor market data out of the U.S., bullion maintains its premium as a hedge, attracting institutional flow in line with the rate-cut narrative...
As of August 6, 2025 (12:23 UTC), Gold (XAU/USD) is trading around 3,367.60, according to Kitco’s live spot price feed. After a sustained bullish recovery from the 3,320–3,330 demand zone, gold finds itself at a structural inflection point. Institutional footprints across the board — from order blocks to liquidity maps — are signaling one dominant message: the...
Gold (XAU/USD) 4‑Hour Analysis: Tactical Setups and Key Levels Gold (XAU/USD) is currently trading around $3,341.585, locked within a well‑defined range as market participants await fresh catalysts. The broader context suggests that the metal’s upside momentum has faded following weeks of consolidation, with price action now respecting technical levels more...
📌 Market Context & Sentiment Overview The gold market is currently trading in a state of technical compression, with the price hovering just beneath the mid-3360s. After a significant rally earlier in the month, the recent sessions have seen price action coiling within a tight ascending triangle—a classic pattern known to precede breakouts. According to recent...
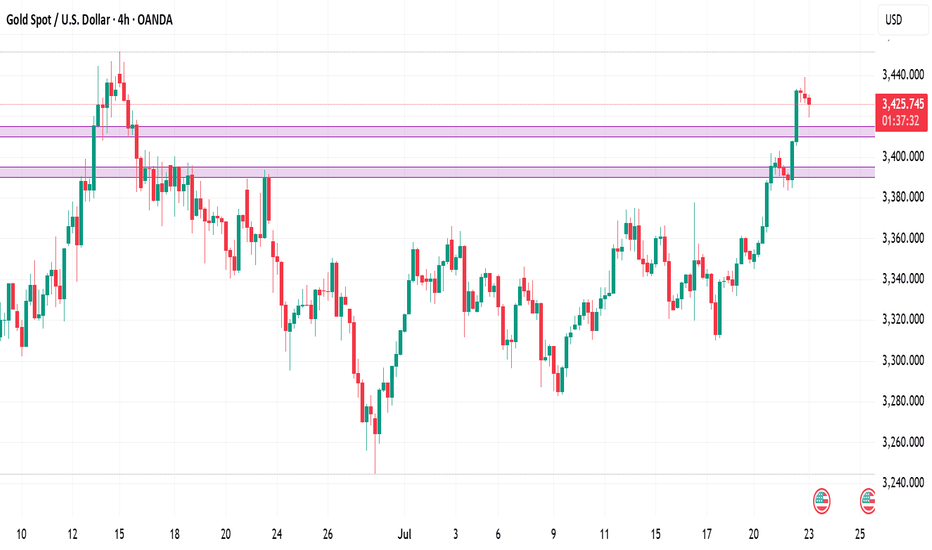
Gold continues to trade in a bullish structure on the 4‑hour timeframe, holding above $3,420 after a steady advance from early July lows. At the time of writing, XAU/USD stands at $3,423.8, confirmed by Investing.com. This analysis employs a comprehensive blend of globally‑recognized technical tools — ranging from price action and classical indicators to...
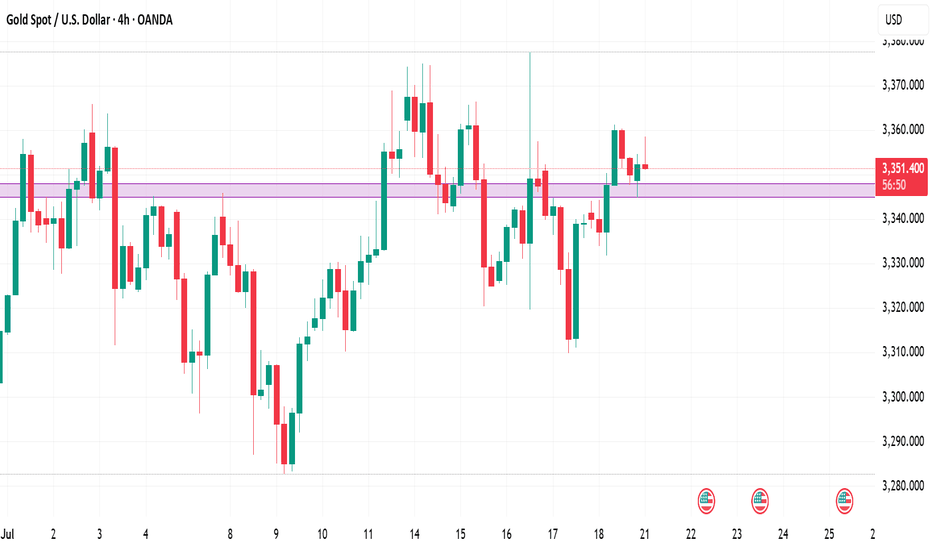
1. Market Overview & Live Price Confirmation Gold is currently trading around $3,354, with a daily range of approximately $3,345–$3,359. This places it firmly within its broader uptrend, showing resilience amid recent macro uncertainties and consolidating its position above key support zones. 2. Four-Hour Technical Breakdown Trend & Structure The 4-hour chart...
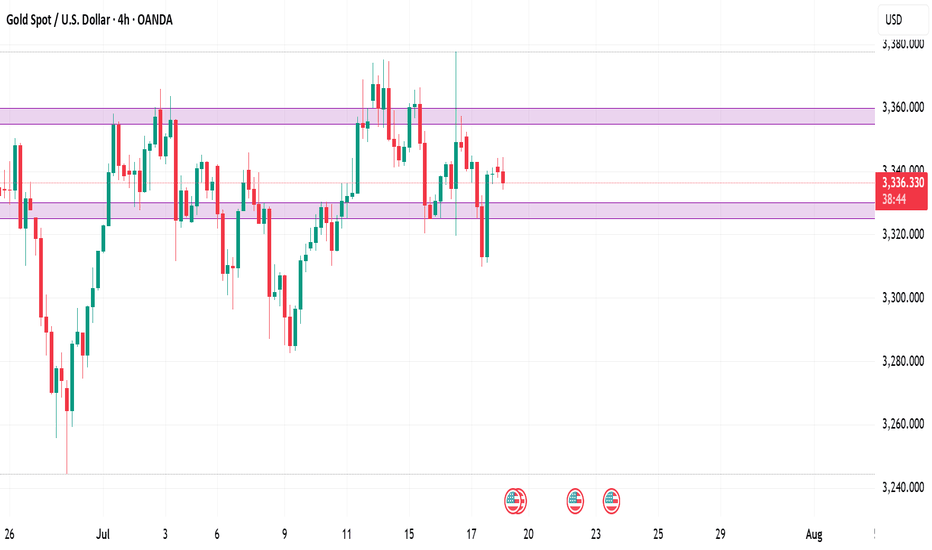
As gold continues to trade near record highs, the market’s current price action around $3,336–3,340 demands a sharp, disciplined technical view. This premium analysis combines price action, Fibonacci techniques, institutional concepts (ICT and Smart Money Concepts), and advanced supply–demand dynamics to identify actionable trade opportunities. We anchor on the...
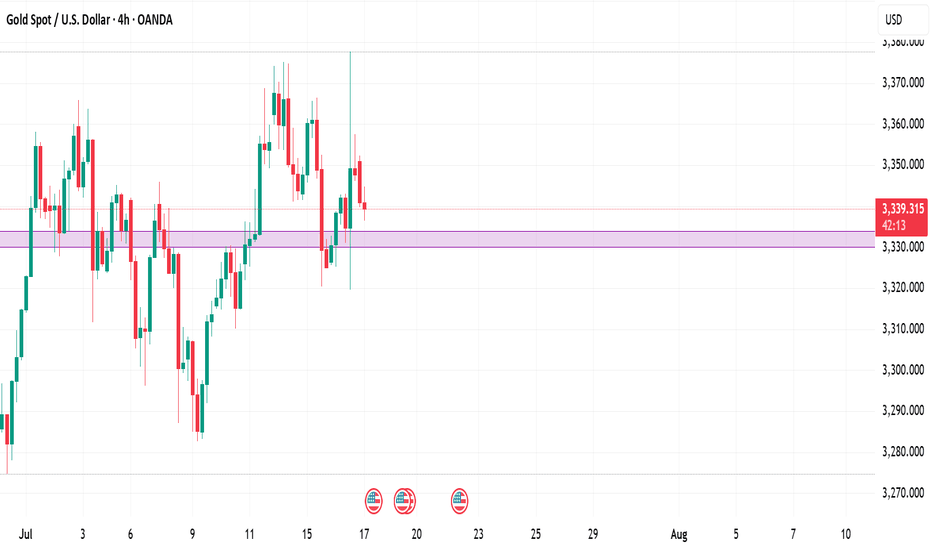
🔷 Market Context and Current Price As of July 17, 2025, gold (XAU/USD) is trading near $3,341, slightly above the week’s midpoint. The metal remains range-bound but shows signs of bullish resilience as it tests key structural support zones. Today’s analysis integrates advanced technical methodologies — including Price Action, Fibonacci tools, ICT and Smart Money...
4-Hour Bias & Structural Context Gold has recently broken above a key structure level at $3,320, confirming a bullish market environment on the 4‑hour timeframe. This follows a Change of Character (CHOCH) around $3,300, signifying a shift from consolidation to an upward trend. The swing from the late-June low ($3,244) to mid-July’s high ($3,374) sets our...
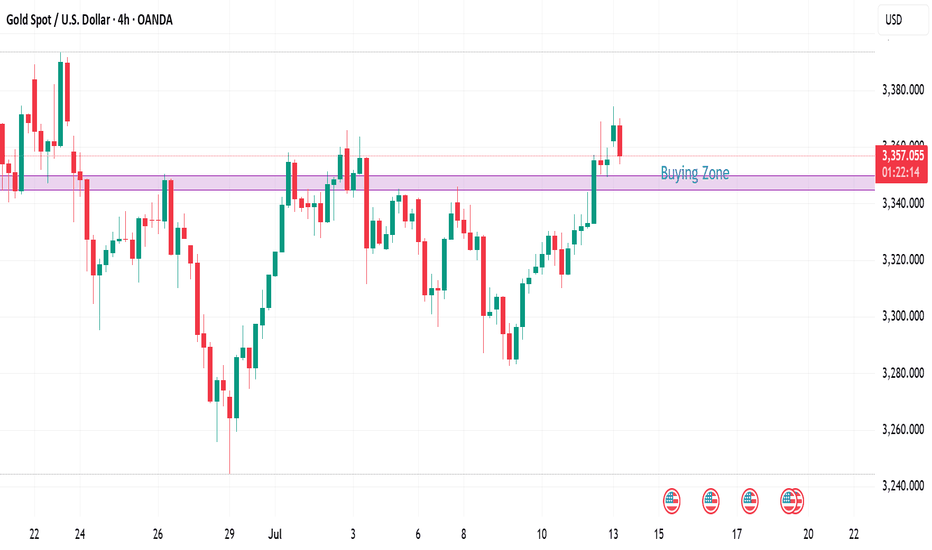
4‑Hour Technical Outlook — Bullish Bias Above Key BOS Zone Gold remains in a strong structural uptrend on the 4‑hour chart, carving out a sequence of higher highs and higher lows. Price is consolidating just below recent swing highs around $3,360, suggesting accumulation after last week’s impulsive rally. We saw a Break of Structure (BOS) above $3,340,...
1. Price Action & Market Structure Gold has broken recent swing highs above ~$3,360, marking a bullish Break of Structure (BOS) and signaling upward momentum continuity Recent pullback zones around $3,350–$3,340 formed a clear Higher Low (Change of Character) — textbook price action confirmation. 2. Fibonacci Retracement / Extension Measuring from the last swing...
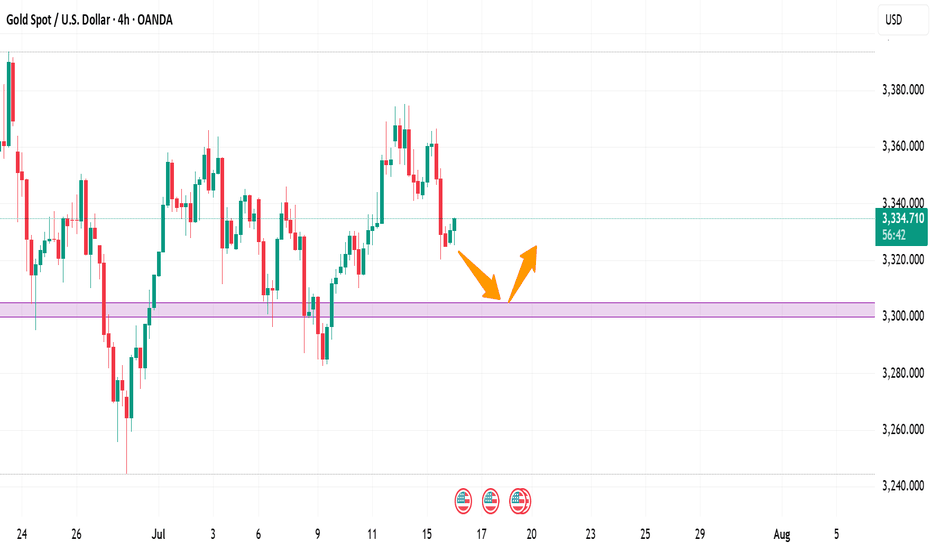
Current Price: ~$3,330 Timeframe Focus: 4‑Hour and 1‑Hour Directional Bias: Neutral-to-Bearish Methodologies Used: ✅ Price Action, Fibonacci Levels, Support & Resistance ✅ Supply & Demand Zones ✅ ICT / Smart Money Concepts (BOS, CHoCH, Liquidity, OB, FVG) 4‑Hour Market Structure Analysis Gold has shifted into a neutral-to-bearish regime on the 4‑hour timeframe,...
In the world of financial markets, few assets capture global attention like gold. A timeless store of value, gold continues to act as both a hedge against uncertainty and a battleground for technical traders seeking high-probability setups. As of today, gold (XAU/USD) is trading at $3328, a level that places it just beneath the most recent multi-month high at...
4-HOUR TIMEFRAME – HIGHER TIMEFRAME BIAS Gold continues to trade near its all-time highs, consolidating just below a recent swing high of $3,315. Despite minor pullbacks, the macro trend remains bullish, with bullish structure still intact. Recent price action shows shallow retracements and strong rejections of key fib levels, a typical sign of underlying smart...
Gold (XAU/USD) is pushing into fresh highs around $3337, and we may be approaching a key inflection point. But beneath the surface of candles and wicks lies the real story — one written by liquidity, displacement, and smart money positioning. This outlook breaks down gold’s price action using Smart Money Concepts (SMC), price structure, and Fibonacci confluence,...
1. Market Structure XAU/USD currently trades at 3333 and shows clear higher highs and higher lows on the 4‑hour timeframe—reflecting a bullish structure backed by recent swing lows above 3300 and highs nearing 3365 2. Key Demand Zones DZ1: 3320–3330 – Consolidation region with multiple wicks and price rejections; confirmed buying volume (aligned with ML and...
📊 4-Hour Chart: Supply & Demand Structure 1. 📐 Market Structure & Bias Gold has bounced off the $3,340–3,350 demand area multiple times—confirming a strong support structure on the 4H timeframe . Following this bounce, gold made a higher-low, reinforcing a bullish trend. Overall bias remains bullish, as long as prices hold above the $3,340 region. A break below...
Gold (spot XAU/USD) is currently trading around $3,358. On the 4-hour chart, price has been range-bound between $3,356 and $3,400. Recently, gold attempted to break higher (up to around $3,394) but quickly reversed — a sign that the breakout may have been a smart money trap. Technically, the structure saw a break below $3,380 in mid-June, leading to a push toward...


