The price is retracing towards the broken major support area, which will probably form a resistance among 1.5270-1.5300 area. I look for a new bearish push towards the recently recorded lows around 1.5000 level. A break back above 1.5400 will probably signal a retest of 1.5585 high. Good Luck, Join me @ twitter.com thefxchannel.com
Previous Analysis in the related ideas below -Bullish rally extended on Inverted head and shoulders breakout. -Price hit 0.9280 resistance level, showing pin bars at resistance - pullback was shallow towards 0.9200 -The price broke above 0.9280 confirmed 0.9337 and 09445 upside targets. - I prefer to look for short entries now, as price was rejected at 0.9445...
Definition: The Bump and Run is a reversal pattern that forms after excessive speculation drives prices up too far, too fast. The first phase is a uniform bullish trend with a trend line slope of 30 to 45 degree, then a period of excessive bullishness with a trend line slop of 50+ degrees, and finally the Run phase which is a period of sell-off. I am looking for...
Update 10/4: Price hits the key directional pivot and first downside target for the earlier forecast (link below) at 382. This should be the main major support for now, and the main remaining floor for price before the next target at 260. Good luck Earlier Forecast 27/3 :( ) BTC is moving in a clear downside bias, where the latest bullish attempt failed to...
The price hits the 78.6 retracement level for the major bearish wave from 105.19 to 97.34 forming a Gartley pattern. Some hesitation is also seen at the potential reversal zone of the pattern. Supply data showed surplus in crude oil inventories. I am already in this trade. Good Luck, Join me @: twitter.com thefxchannel.com
I though that a chart worths Million words :) Good Luck, Join me @: twitter.com thefxchannel.com
Major rejection/pin bar at a confluence of technical resistance levels, the 200-days SMA the 50 percent retracement for the overall bearish wave and the previously broken rising support. We will probably head lower next week, and as long as 94.90 is holding, First downside target at 93.40-93.30 support level. Good Luck, Join me @: twitter.com thefxchannel.com
April 5 Update: In my latest short term technical view at I suggested that the price is breaking out above key resistance levels, hinting further upside in the near term, I suggested that price may retrace lower first before heading higher again. The price indeed retraced, but was that a retracement or a reversal? To have a better picture, I revisited the weekly...
Update: Missed entry A simple counter trend short setup, on a pin bar rejection and Bearish divergence on momentum. Entry is a bit higher at 0.8305, for a better risk-reward. Good Luck, join me at : twitter.com thefxchannel.com ------------------------------------------------------- Still Active Trades: Trading Criteria: 1. Trades are taken in two...
Previous Update: Summary: -Bearish breakout below the 50-days SMA and 0.5 retracement for(1.3476-1.3965 wave. -A dip fell short near 0.618 retracement -Bullish three-drives pattern -Multiple rejection, pin bars -Probably we may head higher in the coming few sessions, to retest the falling trend line, around 1.3755 levels. -Accordingly, dips towards 1.3670...
Previous Update: Summary: - Strong bullish breakout as mentioned in my earlier daily analysis. - over the nearer term, the price is showing a potential pullback signs. - Long legged doji -RSI is starting to lag price action - A pullback towards 103.40-103.45 is likely - taking the high of the long-legged doji 104.11 and closing above it would delay this...
The pair continues to grind higher breaking multiple resistance levels, the descending resistance, and the key high at 103.75. Therefore, the upside remains likely, although we might see a pullback towards 103.40. Next potential target is at 0.786 retracement for the overall bearish wave at 104.40 and 104.85. A break back below 102.60 will probably hint the price...
-Bullish rally extended on Inverted head and shoulders breakout. -Price hit 0.9280 resistance level, showing pin bars at resistance -A pullback looks likely for a possible retest of the broken neckline, target near 0.9135. -A break above 0.9280(daily closing) may negate the pullback scenario extend the upside initially to 0.9349(1.618 extension). -Full target of...
Check Previous Update: Summary: -Short term moving averages clearly indicate a sideways market -Price cleared 102.54-102.70 resistance level -Price hit Dynamic Resistance at the falling trend line currently at 103.15. -Completion of A bearish Bat Pattern at 103.45 -Price corrected towards 102.88 but bounced again marking 102.88 as a fresh short term...
Previous: Update: We witnessed a new bearish attempt towards 1.3720-1.3710 support during the European session, but price failed again to break it, rebounding and breaking 1.3765 resistance. That enhances the short term technical picture, and could extend the upside further. Intraday bias turns bullish now as I mentioned in earlier update that taking that...
The price could be completing a major ABC (ZIGZAG) correction, with wave C taking the shape of an ending diagonal. The recent major rejection formed a shooting star candle, also hints the bearish pressures. I am looking for an initial move towards 1.0110-1.0100 support level. A break below that support and the rising trend line will probably confirm more...
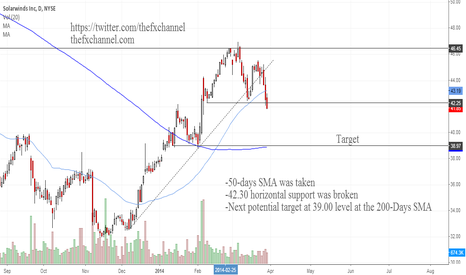
-50-days SMA was taken -42.30 horizontal support was broken -Next potential target at 39.00 level at the 200-Days SMA Good luck, join me @: twitter.com thefxchannel.com
We could head even lower in the near term as price completed a bearish breakout below: 1) Head and shoulders 2)50-days SMA 3)Rising trend line for the latest bullish wave 4)The downside breakout was supported by strong selling volume I will look for a retest of 37.75 support level, followed by areas near the 200-days SMA support at 36.50. Good luck, join me...


