SERNKOU mungkin dalam mod retracement, best buy pada harga 93sen. harga bullish selagi diatas paras trendline biru. Cut loss jika harga jatuh dibawah paras S1 Pirate Flag trigger pada 10 Oktober 2019, mula "ride the trend" Target R1 Support S1
KPJ a profitable company, has started wave 5 leg after a sharp correction. Potential price might attempt R1. If price break above R1, there is potential to reach R2 with sustained momentum on wave 5 with an optimistic Fibonacci projection 1.618. use trailing stoploss based on personal preference to protect your profits. If price failed to break R1, possible it...
Gold masih dalam aliran menurun ('downtrend') dan dijangkakan atas terus menurun sehingga paras sokongan 1212 (S1, garisan merah) iaitu paras terendah pada Julai 2017. Harga masih berada dibawah mid band Indikator Bollinger Band, menandakan pergerakan harga dalam trend menurun. Jika harga berjaya melepasi garisan 'downtrend' biru R1 ke atas, bermakna perubahan...
Gold masih dalam aliran menurun ('downtrend') dan dijangkakan atas terus menurun sehingga paras sokongan 1212 (S1, garisan merah) iaitu paras terendah pada Julai 2017. Harga masih berada dibawah mid band Indikator Bollinger Band , menandakan pergerakan harga dalam trend menurun. Jika harga berjaya melepasi garisan 'downtrend' biru R1 ke atas, bermakna perubahan...
UCREST rallied with above average volume while RSI is in the early bullish region >50%. If price break above R1, there is potential to reach T1 with sustained momentum. If price failed to break R1, possible it will test S1 and trade sideways.
DAGANGAN JANGKA MASA PENDEK (SHORT TERM , ST / MEDIUM TERM, MT) MAHSING sebuah syarikat pembinaan yang stabil dengan keuntungan yang konsisten. Harga saham syarikat bergerak melepasi garisan harga tertinggi sebelum (previous high) garisan biru, dengan minat belian yang tinggi, harga mungkin akan menuju R1. Indicator RSI sekarang telah melepasi tahap Overbought,...
DAGANGAN JANGKA MASA PENDEK (SHORT TERM , ST / MEDIUM TERM, MT) DIALOG sebuah syarikat O&G dengan keuntungan yang konsisten. harga saham syarikat bergerak menghampiri garisan downtrend R1. Jika minat belian yang tinggi, harga mungkin akan melepasi R1. Jika ini berlaku, maka pergerakan berkemungkinan akan menuju ke R2 dan R3 (garisan hijau) jika minat belian...
MYEG sebuah syarikat teknologi yang stabil mempunyai keuntungan positif. harga saham syarikat bergerak melepasi harga tertinggi sebelum ini (previous high) pada 1.04 dan juga telah melepasi uptrend channel (garisan biru sebelah atas), berkemungkinan menuju ke arah R1 (garisan hijau). Kadar belian meningkat berbanding hari sebelumnya dengan kadar belian sebanyak...
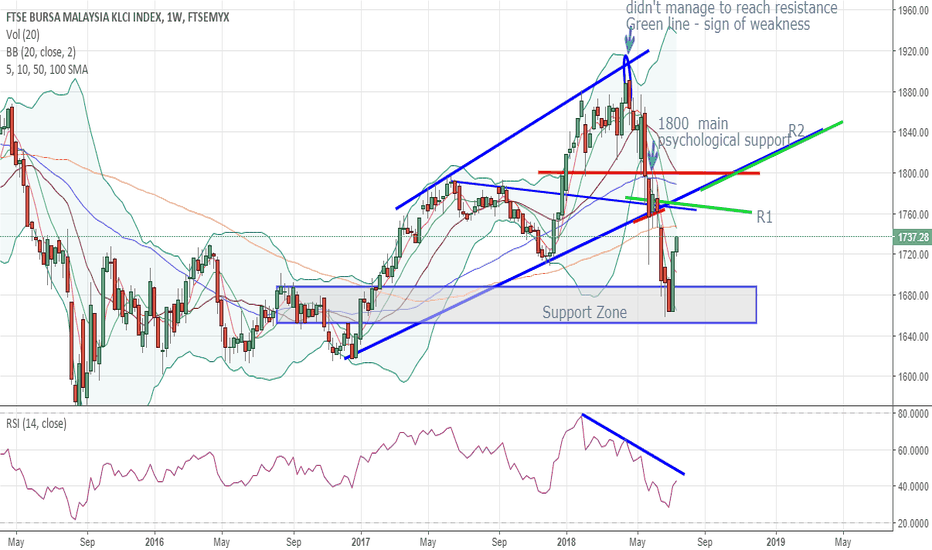
KLCI staged a breather from a sharp drop since early May after failed attempt to break and close above 1900 level. Short term uptrend with Resistance set at R1 and R2, if momentum continues, might signal a comeback. But for now, bearish trend still in effect.
OIL has reached weekly high of around $75 at 1.382 fibonacci projection for on wave 5. Potentially a reversal point as the developing weekly candle also looks like a Doji. Potential entry point for short. Correction ABC is expected when the price reverses.
Volume spike on MPAY, price closed above previous high (closing) - a break out. Potential fast in fast out (FIFO) play if there is a volume follow up tomorrow Target R1. Take profits EARLY to avoid dumping. Cut losses short if price went below S1.
KRONO is a profitable company, breakout the triangle consolidation pattern with strong volume. Price might break R1 and attempt R2 (previous high). Take profits regularly to avoid dissapointment. Cut losses short if price went below S1.
LEESK is a profitable company, attempting the Resistance zone with strong volume signalling potential breakout might be inevitible. If price manage too break resistance zone, price might be heading to R1 fibo projection of 1.628. Take profits regularly to avoid dissappointment. Cut losses short if price went below S1.
SYSTECH is a profitable company, heading to Resistance zone with stepper uptrendline, signalling potential reversal might be developing. If price manage too break resistance zone, price might be heading to R1 and R2 if the momentum continues. Cut losses short if price went below S1.
Target set at R1, while Stoploss set at S1 incase price made a u-turn. bigger picture: price is within a bigger Potential Ascending Triangle. Larger / higher target (X to X) can be achieved once broken R1.
Inverted Head & Shoulder / Bullish Reversal Pattern with RSI in the bullish region. Take profit at R1, or slightly below. If price moved below S1, cut position. Previous / earlier posting: www.borakbursa.com
PIE a profitable company, has broken out descending triangle chart pattern while RSI is bullish. potential price will attempt R1. If price break above R1, there is potential to reach R2 with sustained momentum. take regular profits, preferably at 50% and 78% from target. If price failed to break R1, possible it will test S1 and potentially trading sideways.
YEELEE a profitable company, has been trading within descending triangle chart pattern while RSI is heading into the bullish region 50%. Recent buying interest emerged, and there is a potential that price will attempt R1 while RSI is above 50%. If price break above R1, there is potential to reach R2 with sustained momentum. take regular profits, preferably at 50%...


