The-white-goat
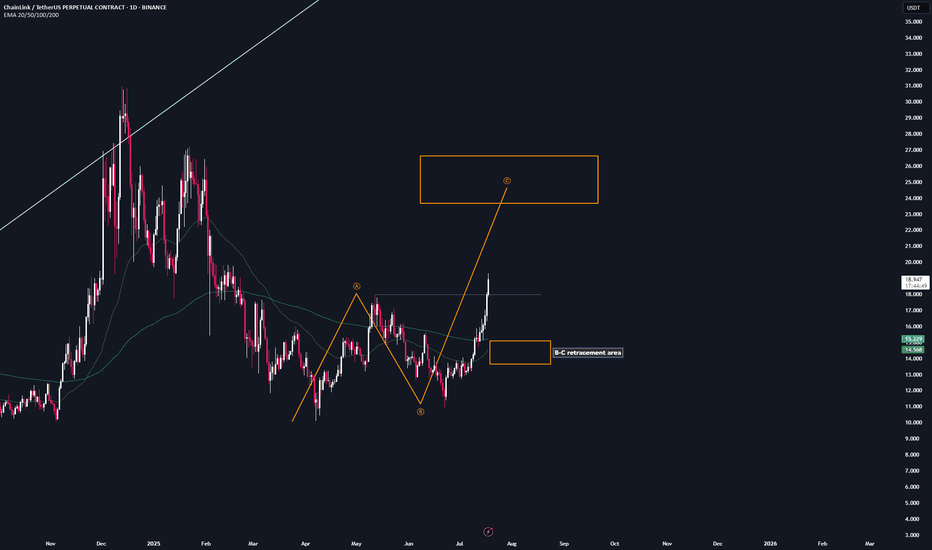
Essential📌 After the breakout from the last high at $18, a bullish sequence (orange) has now been activated. 📊 These setups typically occur no more than twice per year on any given altcoin, so I’ll be aggressively buying each level at the B-C retracement area. Trademanagement: - I'm placing long orders at each level. ((If the price continues climbing, I’ll adjust the...
📌 After the breakout from the last high at $0.86, a bullish sequence (orange) has now been activated. 📊 These setups typically occur no more than twice per year on any given altcoin, so I’ll be aggressively buying each level at the B-C retracement area. Trademanagement: - I'm placing long orders at each level. ((If the price continues climbing, I’ll adjust the...
We’ve almost reached our final profit target (orange). Once we get there, I’ll take out most of my margin position and let only a small portion run. Same situation as with $ADA... 13 R/R since my call — you don’t need a strategy with an 80% win rate. A 30–50% win rate is more than enough if your risk-to-reward ratio is solid. I don’t think any of you have taken...
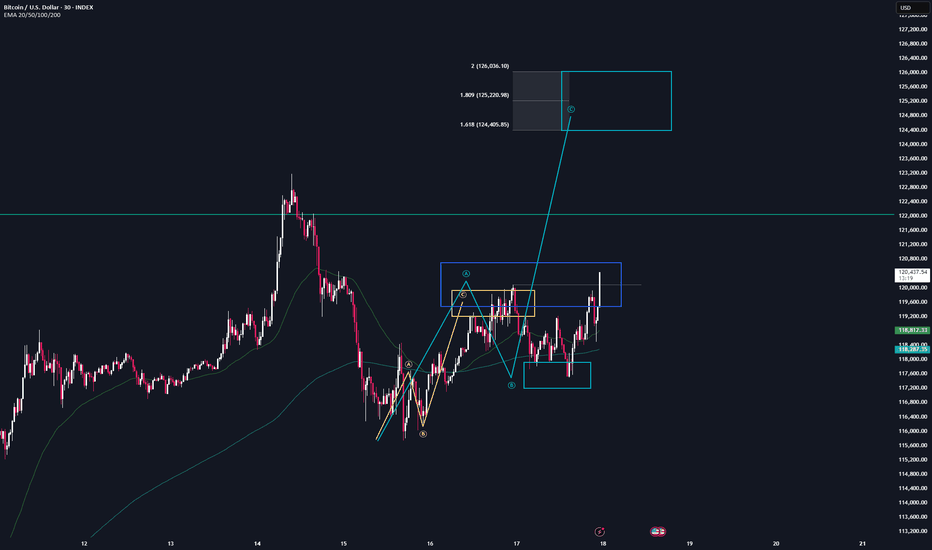
We just activated a new bullish structure on the lower timeframes for CRYPTOCAP:BTC , which will take us to 124K. There’s a high probability that this setup will play out, so keep an eye on it. However, once we reach all-time high (ATH) regions make sure you dont get fomo. Position yourself when others are in fear — or regret it later. There’s no point in...
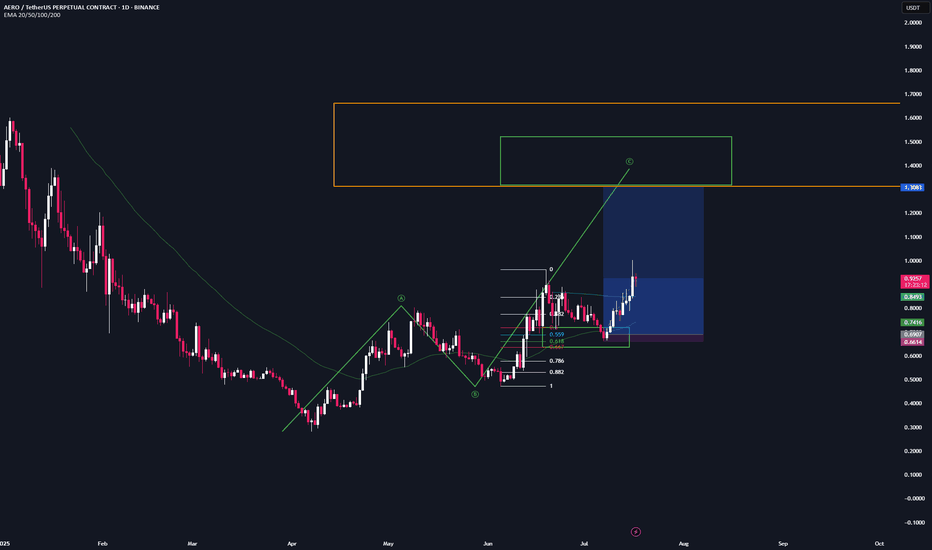
We’re in full profit on our $AEROtrade. I took 30% out at the last high, the next target is the bullish target zone (green) Gave yall that one for free — 12 R/R so far lol. Your win rate doesn’t need to be high — 30–40% with solid R/R is enough to be profitable. Have a blessed day!
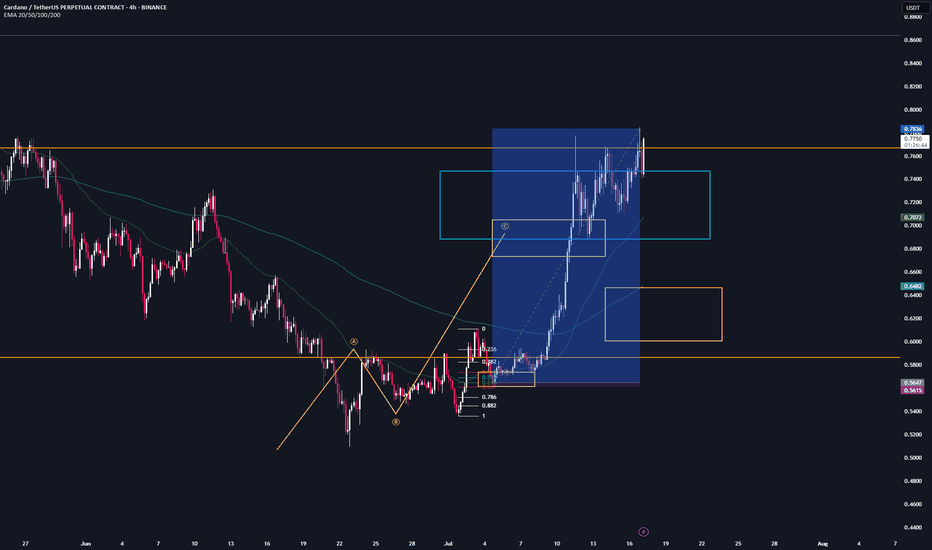
We’re in full profit on our CRYPTOCAP:ADA trade. I took the final profits at the target zone (yellow); just a small portion is still running. Gave yall that one for free — 68 R/R, lol. Your win rate doesn’t need to be high — 30–40% with solid R/R is enough to be profitable. Have a blessed day!
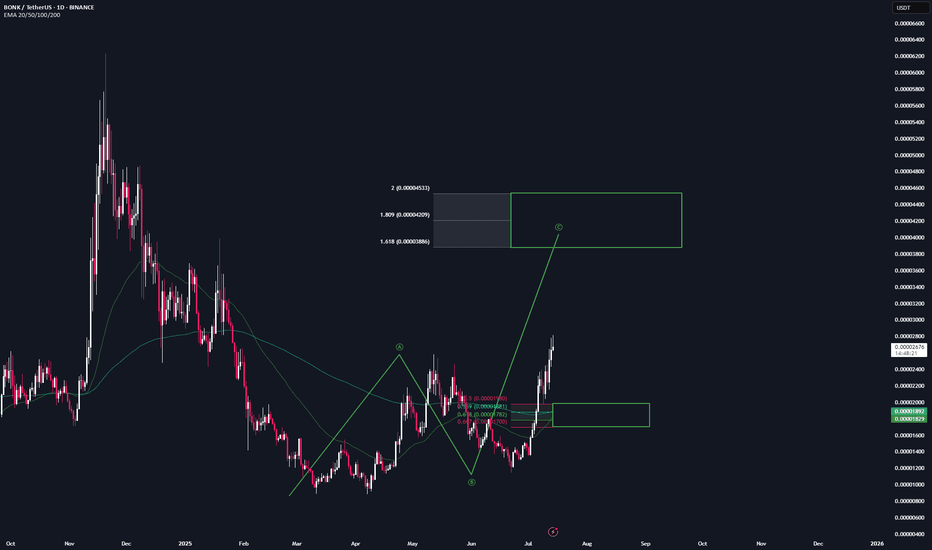
📌 After the breakout from the last high, a bullish sequence (green) has now been activated. 📊 These setups typically occur no more than twice per year on any given altcoin, so I’ll be aggressively buying each level at the B-C retracement area. Trademanagement: - I'm placing long orders at each level. ((If the price continues climbing, I’ll adjust the trend...
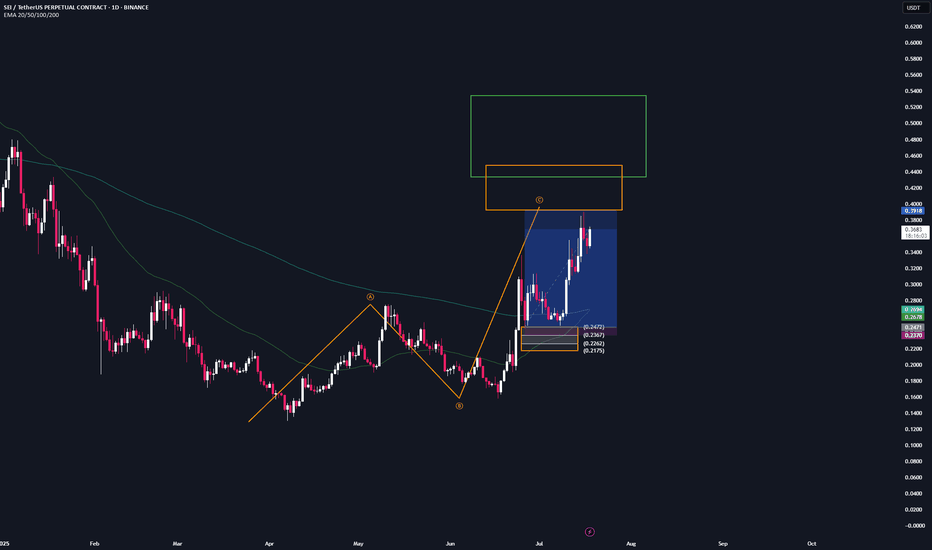
📌 After the breakout from the last high at $0.26, a bullish sequence (green) has now been activated. 📊 These setups typically occur no more than twice per year on any given altcoin, so I’ll be aggressively buying each level at the B-C retracement area. Trademanagement: - I'm placing long orders at each level. ((If the price continues climbing, I’ll adjust the...
📌 After the breakout from the last high at $0.23, a bullish sequence (green) has now been activated. 📊 These setups typically occur no more than twice per year on any given altcoin, so I’ll be aggressively buying each level at the B-C retracement area. Trademanagement: - I'm placing long orders at each level. ((If the price continues climbing, I’ll adjust the...
📌 After the breakout from the last high at 2.6, a bullish sequence (green) has now been activated. 📊 These setups typically occur no more than twice per year on any given altcoin, so I’ll be aggressively buying each level at the B-C retracement area. Trademanagement: - I'm placing long orders at each level. ((If the price continues climbing, I’ll adjust the...
📌 After the breakout from the last high at 2.9k, a bullish sequence (green) has now been activated. 📊 These setups typically occur no more than twice per year on any given altcoin, so I’ll be aggressively buying each level at the B-C retracement area. Trademanagement: - I'm placing long orders at each level. ((If the price continues climbing, I’ll adjust the...
We are now, once again, in the long-awaited price discovery phase for Bitcoin since last week. But this is not the time for impulsive FOMO moves. You need to understand where we are in the current cycle — and how you are positioned. Right now, the sell button is more relevant than the buy button. This weekly candle also brings us to another critical moment: a...
ETH is currenty retesing its key support & resitasnce area over the last 2 years, every breakthroiugh let to an major rally Once we can close above it expect bullish moomentum to contiue to new ATH reagions
A few days ago, we activated a new bullish structure on SPARKS:AERO on the daily chart. I’m opening a long position at each key level, as there’s a high probability the market will react bullish from there, The target region lies at $1.32
Our trade worked out exactly as planned, and the price reacted perfectly from the 0.667 level, which also overlaps with the bearish target area (green). ✅First take profit was at the overall correction level (green). Second take profit is when we reach the 100% correction mark at $0.611. At that point, I will secure most of my position and only let a small portion run.
📌 After the reaction from the bearish target zones (blue), we've now activated a bullish sequence (yellow) in $Avax. 📊 Valid entries are currently forming during a potential B-C correction. Trademanagement: I'm placing long orders at each level. Once the trade reaches a 2 R/R, I’ll move the stop-loss to break-even. From a 3 R/R onward, I’ll start locking in...
📌 After the reaction from the bearish target zones (blue), we've now activated a bullish sequence (yellow) in $Near. 📊 Valid entries are currently forming during a potential B-C correction. Trademanagement: I'm placing long orders at each level. Once the trade reaches a 2 R/R, I’ll move the stop-loss to break-even. From a 3 R/R onward, I’ll start locking in...
📌 After the reaction from the bearish target zones (blue), we've now activated a bullish sequence (yellow) in $ADA. 📊 Valid entries are currently forming during a potential B-C correction. Trademanagement: I'm placing long orders at each level. Once the trade reaches a 2 R/R, I’ll move the stop-loss to break-even. From a 3 R/R onward, I’ll start locking in...
