TheBullandBearLounge
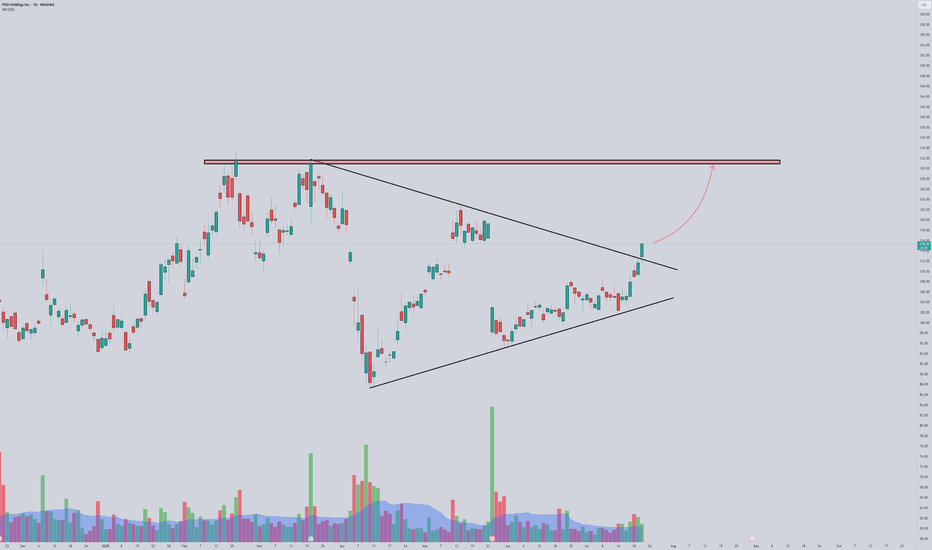
PlusThis chart looks insanely good. To go with the breakout there was today a 1.5M order for November, 135c. I am looking to buy dips on this name!
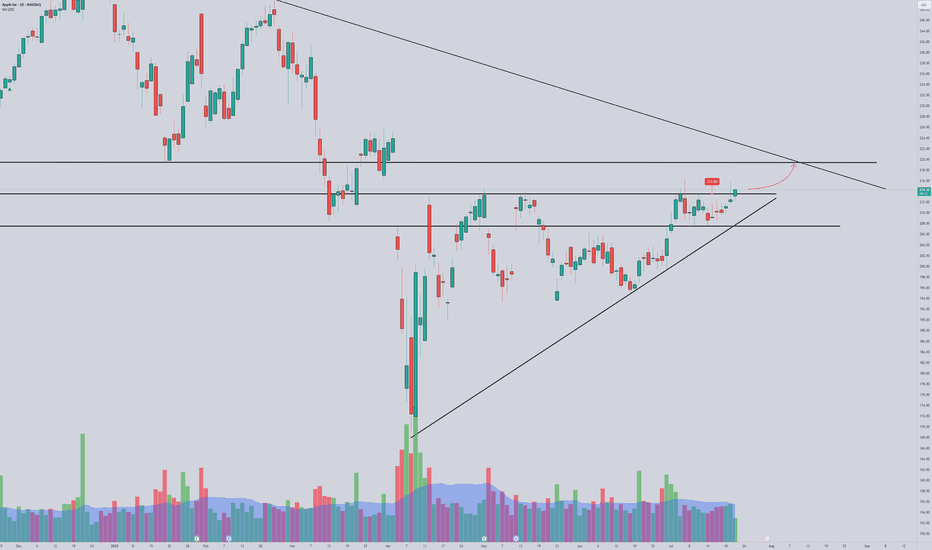
A daily close above 213.75 could set AAPL to move towards 220 We are retesting some strong resistance at 215, and above it we could see price moving faster to retest trendline. Keeping this on the watch as ERs is not far and we can see a pre run
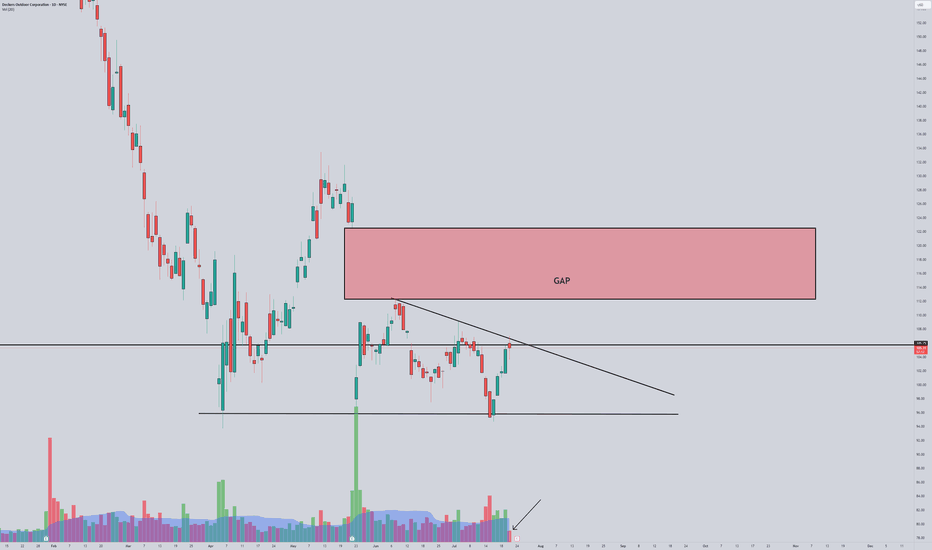
On 7/21 a OTM call flow came in for 114c expiring this Friday July 25th Almost $130k in calls on a strike that has very low OI. We have a beautiful gap above and a possible flag break in very low volume today. Also, ER on thursday. Do they know something??
Pattern: Classic cup and handle formation. Handle forming as a bull flag — very bullish continuation setup. Resistance: ~$57.78 — key neckline from prior highs. Needs strong close above this level for confirmation. Volume: Declining during handle = textbook. Suggests controlled pullback. Watching for volume spike on breakout. Moving Averages: Price is trading...
We are opening at 44 which is the contracts the flow picked up (once again they were right) But this chart is showing a lot of potential, as we broke above the trendline, i will watch 45 for an entry with a possible $60 target
🔍 NASDAQ:ASTS Weekly Chart Analysis (Accurate) Pattern: Massive bull flag / consolidation wedge after a parabolic run. Current Price: ~$31.20, sitting near the midpoint of the descending channel. Structure: Price is compressing between lower highs and higher lows. Volume spikes on up moves, low volume on pullbacks = bullish accumulation. Testing upper...
TOST Technical Analysis (Breakout Setup): Current Pattern: Bull flag forming after a strong breakout from the $40.50 zone with increasing volume. Resistance: $44.33 – key level to break for momentum continuation. Support levels: $42.00 (top of previous consolidation zone) $40.55 (bull flag base and breakout pivot) Ideal Breakout Play: Watch for breakout...
TTD has been beat to pieces the past month. However we have just reached a multi month support which could present a short term bounce
LULU currently showing some strength compared to the market. Price is breaking out from the channel. I am waiting for the candle close so I can find an entry
This has been a frustrating name to trade because everytime it gets some sort of negative news, but the technicals are here. Broke out on the daily yesterday, I will be looking for an entry above yesterday's high, but my A+ setup would be a daily candle closing above $28.50
Looks really good Break of the support flipped resistance. Volume higher today on the breakout I will set alerts above today's highs
CART has just made a new ATH today, however, volume was not present. Ideally we want to see this price holding and volume coming in for a push higher
ASTS is forming a bullish pennant on the weekly chart, characterized by a pullback on declining volume after a strong impulse move. The stock recently made a high near $25 and is consolidating in a tightening range, indicating a potential continuation pattern. The declining volume during this pullback suggests sellers are weakening, while buyers are likely waiting...
After a shake out a couple of days ago due to news, yesterday we saw a break above the multi-month trendline and now we are flagging within the smallet timeframe. I will wait for a candle close above the hourly trendline for an entry
Broke out of daily channel, now we need yesterday's highs to be taken, I see a good entry above 241.20
Has been holding despite of weakness all across the board. A hourly close above $20 is an entry for me, with target at 23.50
After seeing over 1000% on RGTI and IONQ QS is offering a very similar setup with great R:R Can see $10 in the first semester
We have a daily triangle breakout. Entries above 25 can work


