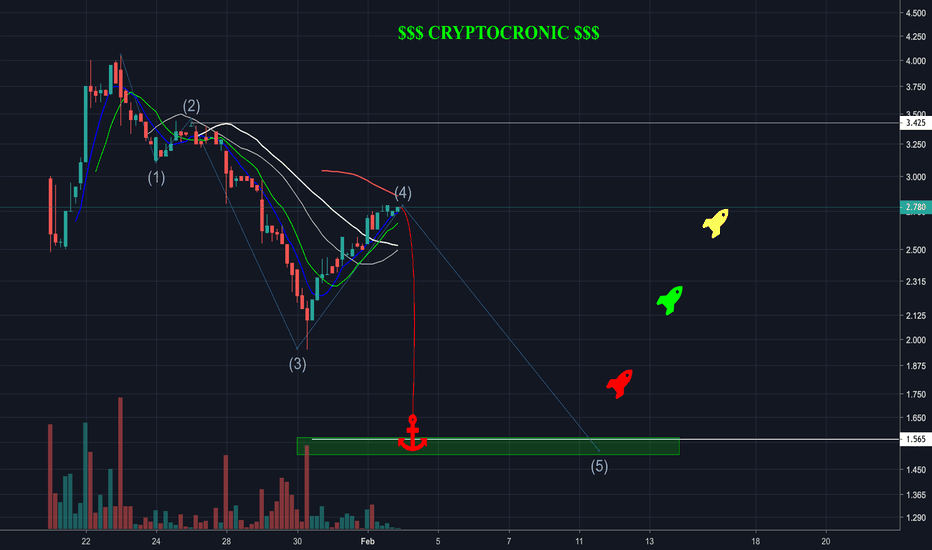
Looking at Yeti, This thing has been a true FUCKING BEAST ! Ran %138.55 percent in the last 83 days but at some point even Yeti's have to fight with the bears to survive ! I see a perfect elliot wave structure , this being the 5th wave and also showing bearish divergence on pretty much every timeframe i will be looking for a short. I got my 5th wave projection by...
Just market makers playing games ,RSI getting to be oversold on alot of timeframes. Retail traders been getting wicked out by Arthur hayes and crew .. Carefull out here guys , I think this last run is a fakeout before the final fall to whatever bottom is.
Looking at SNAP I can see that there is bearish divergence pretty much on every time frame.We are in a rising wedge and We have also just tested the 200 MA . There is not enough juice left in this bitch to break the 200 ma so that is my reason to short it down . Targets posted
CSE:BILZ This looks like it is in a corrective wave 4 , wating for it to finish its final 5th wave down . Targets set on chart but will be layering in longs from $1.50- $1.75 Good luck y'all
Just finished 5th wave , need to come down for a correction now. targrets posted
Aurora is now getting close to the oversold territory on a 1day chart , im expecting a pop up to around 10.50 before we do a correction. I will be shorting this correcton . Targets set on chart . If top target changes i will obv be changing my retracement targets
Been keeping a close eye on this one , i see this as a final 5th wave down . Even though pot stocks are overvalued. This one being brand new to the market not long ago m i feel this needs to have at least one good run before getting smashed back down. Lets see what it does Targets Posted ...
Apple is just about to do a dirty 50/200 death cross, im gonna try play this little dead cat bounce hopefully where my orders are set @ $145.85 ... targets posted for retrace then im going short
Just noticed we put in a 3peaks pattern , lets see if this plays out A break of 262 will take me to my final correction target of $255 Then one more nice run before a big correction is due .
Spy still looking bearish , this is just an update from my previous target due to new info
just picked a few targets and wanted to post for fun, lets see how it works out , gained some good steam today
Organigram is looking weak but looking for a bounce. We are currently holding a trendline that dates back to April 10, we broke through it the last hour of trading today but we did close above. Looking for this to break , there is not much freshness left . The RSI still has a little room to run down , so does the stoch. There is an RSI of 35, the last time we...
We are trying to hold a trenline that dates back to April 10 /2018 , we dipped below and then closed above this support trendline during the last hour of trading . I see this line breaking for a short period before our big bounce . With an RSI of 35 on the daily chart it is gonna reach oversold conditions real soon.It likes to bounce big in this area. We were...
Looking at the daily chart the daily candle looks like it closed as a bearish pin bar . The hourly chart looks like it closed out an evening star patten .Whales are cashing in, spy is scaring people.. I feel a retrace to test the .786 at least and would like a wick down to test the trendline that dates back to january.
Looking at the daily chart i see that the Trendline dating back to march has broke , testing the trendline dating back to january 2018.. Will be waiting to long 68c


