TheChartereds
PremiumHere I am sharing my perspective on the technical chart. The chart is self explanatory as always. TCS Q4 Results – Net Profit Declines 2% YoY to ₹12,224 Crore, Misses Street Estimates. Salary hikes for employees have been paused due to ongoing global uncertainties. This is not a happy sign for sure. IMHO, the 2890 - 3000 price range may be tested soon, which is...
The chart is self - explanatory as always. Nasdaq is sitting at a critical zone — the previous all-time high area — with the 200-week EMA just below. 📊 From a technical standpoint, a bounce here would signal potential strength. ⚠️ But when panic sets in, technicals can take a back seat. Stay sharp. Manage risk. Disclaimer: This analysis is purely for...
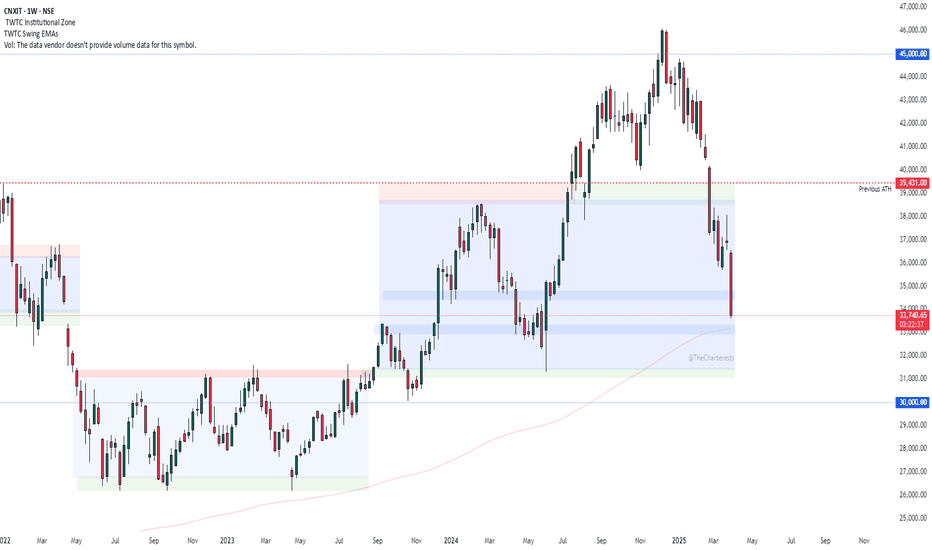
The chart is self-explanatory as always. Trump's tariffs have sparked serious recession fears in the U.S., negatively impacting both the U.S. economy and its trading partners. Nifty IT is simply following the lead of IG:NASDAQ , which saw a sharp decline of over 5% yesterday. From a technical standpoint, the price is currently at a crucial level near the 200...
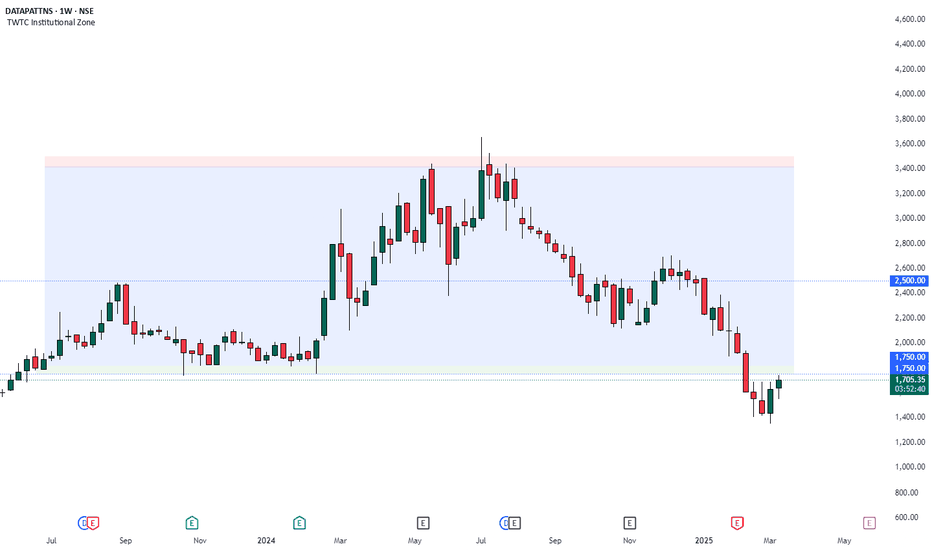
The chart is self-explanatory as always. The stock kept a downward trend eroding over 63% in value from its ATH in July,2024. The price recently breached a crucial support at the 1750 level. The stock is up 7% today and the price seems to be returning to this level. The question is, Is this a reversal move to end back in the zone OR Is it just a...
📉The NASDAQ witnessed a sharp decline of approximately 4% yesterday, extending its overall downturn to nearly 13.5% in just three weeks, indicating a strong bearish sentiment. 📉On the other hand, Nifty IT has so far been holding above the 100-week exponential moving average (WEMA), which has been acting as a crucial support level. 📉However, given the significant...
The chart is self-explanatory as always. But the big question remains—can silver break past the 100k mark this time? The ongoing trade war between the U.S. and other nations fuels geopolitical uncertainties, which historically redirects attention toward safe-haven assets like gold and silver. Adding to the bullish case, industrial demand for silver continues...
- The price is self-explanatory as always :) - Titan has broken its long-term range on the downside, signalling weakness. - ₹3,000 is a psychological support level, which may act as a bounce point. - ₹2,900 is the most recent price-based minor support that could provide stability - The next best support zone stands at (₹2,750 – ₹2,800) coupled with 200WEMA. What...
The chart speaks for itself, as always. This is a prime example of why buying a company solely because it’s "new age" can be a mistake. Given the widespread adoption of drones, you’d expect a drone manufacturer to perform well. The stock debuted on the NSE at ₹1,300 per share—a staggering 93.5% premium over its issue price. At the current market price, 73%...
- The chart is self-explanatory as always. - JIOFIN is reaching its ATL. - The stock is down 40% since it started its downward trajectory. - JIOFIN is to be added to Nifty50 by March end -The company reported a slight 0.32% increase in consolidated net profit for Q3 FY25, with earnings of Rs 294.78 crore compared to Rs 293.82 crore in the same period last year....
- Here is my perspective on what Bank nifty should would and could do in the next one month. - All my perspectives are laid down on the chart itself. - 50,000 became a good resistance for now. - The price is at a good support zone. - Whatever happens, it is important to keep your plan ready. - Follow this idea because we will keep updating it. Disclaimer: This...
Patanjali showed resilience while the broader market was deep in the red. Its downside was relatively limited. However, today, the stock suddenly dropped 10%, hitting the lower circuit. It's attempting a recovery and remains in a decisive zone. The price structure still looks promising for now. What’s your take on this? Disclaimer: This analysis is purely for...
- Here is my perspective on what nifty should would and could do in the next one month. - All my perspectives are laid down on the chart itself. - 22,500 is a good support but unfortunately the 100 WEMA is below it so we may see some penetration below 22,500. - Whatever happens, it is important to keep your plan ready. - Follow this idea because we will keep...
- The chart is self-explanatory as always. - The price is respecting the support and resistance - One-year-long consolidation range - One of the strongest companies in this domain - The capital market enablers theme has performed quite well in this bull run. I would like to keep an eye on this. Disclaimer: This analysis is purely for educational purposes and...
- The chart is self-explanatory as always. - We have reached a support zone after dropping 5% today owing to lukewarm results. - Axis Bank Q3 results: Net profit rises 4% YoY to Rs 6,304 crore, misses estimates - The 1000 may act as a crucial point. - Keep an eye on it. Disclaimer: This analysis is purely for educational purposes and does not constitute trading...
The chart is self explanatory as always. After forming a nice IPO range, The stock broke down. Where do you expect this to stop? Disclaimer: This analysis is purely for educational purposes and does not constitute trading advice. I am not a SEBI-registered advisor, and trading involves significant risk. Please consult with a financial advisor before making any...
The chart is self-explanatory as always. The price has followed the textbook price action of Breakdown, Retest and continuation. 750 acted as a support previously, Once it was broken, It was retested and failed to cross over. The price has now given a breakdown of the wedge pattern. It will be interesting to watch if it reverses from here trapping sellers. Or...
The chart is self-explanatory as always. The price is at a crucial juncture. The 1250 level is holding up for now. If it drops with a good volume, We may see some down move to the previous swing level. The question is, Will it bounce back?? Disclaimer: This analysis is purely for educational purposes and does not constitute trading advice. I am not a...
The chart is self-Explanatory as always :) Here’s a quick summary: - The Price stayed in a range for about 8 months followed by a strong breakout - The psychological level of 2,000 was breached after a short consolidation which is a positive - The chart was shared in the learning community just yesterday. Check the signature column below to join the...


