The total crypto market cap excluding Bitcoin (TOTAL2) is still sitting right below a crucial resistance zone. A breakout from here could trigger a strong altcoin rally — but until then, patience is key. It’s a waiting game now…
Bitcoin is testing key support around $103K. A breakdown below this zone could open the door to sub-$100K levels. Watch closely!
The daily chart for ADA/USDT shows that Cardano is still trading within a clear descending channel, facing consistent resistance near the upper trendline. Recently, the price was rejected from a key resistance zone Green between $0.8140 and $0.8416. Despite several attempts, ADA has struggled to break above this level, reinforcing the bearish outlook. Strong...
ATH 2017 (~$20K): The top of Bitcoin's 2017 bull market. ATH 2021 (~$69K): The peak of the 2021 bull cycle. These two ATHs are connected by a long-term diagonal resistance line, forming a key trendline. Current Price (May 2025): ~$109,772 — Bitcoin is approaching this major trendline for a third time.
AVAX/USDT has broken market structure to the upside by forming a confirmed higher high, indicating a potential bullish trend reversal. However, despite this structural shift, the price failed to secure a daily close above the key resistance level at $26.02, leaving the breakout unconfirmed for now. Currently, the pair is trading marginally above an ascending...
Total Altcoins Market Cap is at resistance level at $966B and descending channel upper boindary. A breakout from here could signal a strong shift in momentum
The bear market in altcoins—characterized by their continued underperformance relative to Bitcoin—remains in effect. However, a strong bearish divergence is forming on the Bitcoin Dominance chart, indicating a potential reversal. This suggests that Bitcoin's dominance may decline soon, potentially signaling the beginning of a capital rotation into altcoins.
Ethereum’s $2,328–$2,400 blue support zone was an excellent buy range. If the price breaks below this zone, the last opportunity to buy may be at the yellow support zone. In the coming weeks, if Ethereum breaks above the green resistance zone at $2,727–$2,833, we could see new highs. I believe this breakout would signal the beginning of a new bull run.
The $85K–$86K zone has undergone multiple retests as a resistance level. Repeated tests of resistance typically indicate weakening supply pressure, increasing the likelihood of a breakout.
IOTA has been in a downtrend since early December 2024. However, the price is now showing signs of a potential trend reversal. A clean break above the $0.1737 level and the descending trendline would be a strong first step. Price has held firm support in the $0.1307 – $0.1421 blue zone.
CRYPTOCAP:ETH price remains extremely compressed, showing minimal movement for nearly 3 days. This type of consolidation often comes before a significant move — now it's just a matter of waiting for the breakout in either direction.
This 4-hour Bitcoin chart highlights a descending trendline acting as resistance, while an ascending trendline supports the price. The price is consolidating near a key resistance zone Green at $84,705 - $85,556, indicating a potential breakout above the trendline. A successful breakout and retest could lead to a bullish move toward the higher resistance zone Blue...
Crypto Total Market Cap Excluding Top 10 Dominance (%) on a weekly timeframe, showing a long-term downtrend with lower highs. Price is currently testing a strong support zone Green around 8% dominance suggesting a potential reversal. If it successfully bounces from this Green zone, the next key resistance is around 10-11% Blue zone, aligning with the descending...
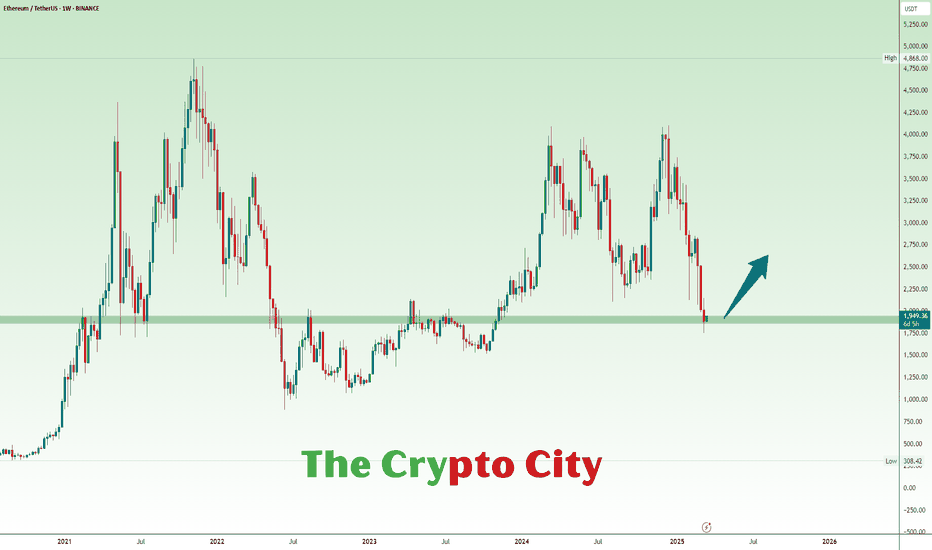
ETH is trading at a key support level, signaling a potential strong rebound. If buyers step in, a sharp upward move could follow.
NEAR is trading below a trendline from December, currently holding within the blue support zone at $2.091–$2.350. A breakout above the trendline and $2.712 resistance could trigger bullish momentum. The key resistance at $3.563, which previously acted as strong support, could pose a challenge. After breaking below, the price consolidated under this level for 28...
A few months ago, the total crypto market cap surged past its previous highs, reaching a new all-time high of $3.7 trillion. The current pullback appears to be a bullish retest of the breakout level, potentially setting the stage for the next upward leg.
Bitcoin dominance ( CRYPTOCAP:BTC.D ) has been stagnant lately, partly due to rising stablecoin dominance. BTC pairs are holding up better than before, hinting at seller exhaustion or a delayed reaction. I believe altcoins will outshine BTC on its next big move; otherwise, both will keep drifting lower.
The CRYPTOCAP:TOTAL Crypto Market Cap dipped below its 2021 highs once more. Last week's candle held, but prices slid lower this week. Watching the weekly close to sustain the high timeframe uptrend.


