In an ascending channel & meeting the descending resistance. Ascending channels breakout to the downside. We were rejected at the descending resistance, and have ran out of steam. I expect us to fall to $7,500 BTC. The numbers all over the chart are the top 5 largest BTC wallets showing when and how many BTC were moved into those wallets. Each color represents a...
We have been stuck in this symmetric triangle for a couple years now, and it doesn't look like we are getting out any time soon. I have been saying this since the local $14,000 tops were established. We have a chance to fall below $6,000. Expect price action to remain between $6,000 and a declining $11,000 until 2021.
BTC has formed a descending triangle on the hourly chart. Expect breakout to the downside with support around $6,660-$6,680.
EOS - Falling Wedge Reversal In Store - I believe we are still in a no trade zone, but there may be an opportunity here - wait for confirmation breakout to buy.
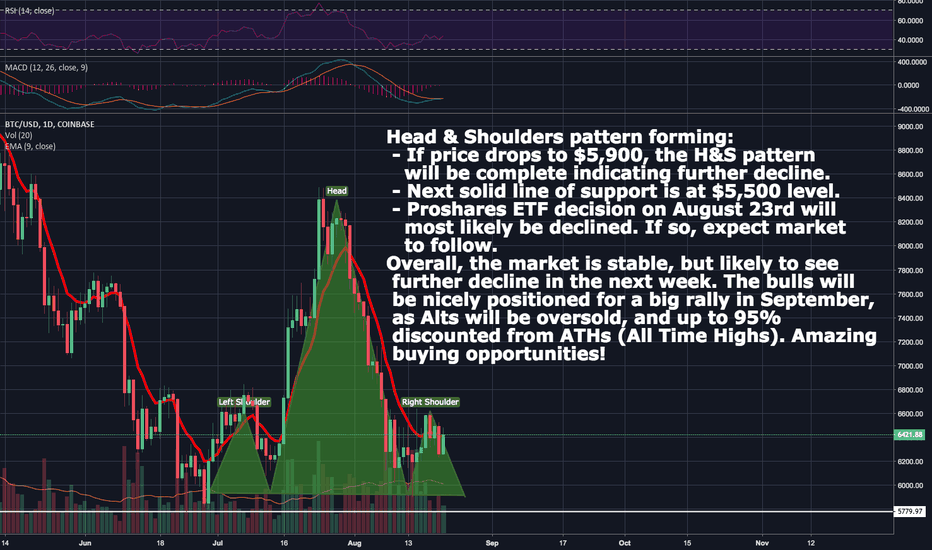
Head & Shoulders pattern forming: - If price drops to $5,900, the H&S pattern will be complete indicating further decline. - Next solid line of support is at $5,500 level. - Proshares ETF decision on August 23rd will most likely be declined. If so, expect market to follow. Overall, the market is stable, but likely to see further decline in the next...
Short-term Ascending triangle - waiting for breakout - Hard capped at $6,600 w/ bears in control - Finding support at 61.8% fib level ~$6,350 - Expect sideways action between $6,350-$6,600 - A break above $6,650 would put the bulls back in the driver's seat
- Still bullish on the weekly as we are above the MA. MACD & RSI are showing oversold levels indicating a reversal. We could retrace to $6,300 in an extreme case. - Expect big market shift in Sept. regardless of ETFs. - As of now $7,500 is our new support.
BTC has formed an ascending triangle? If so, we should see a positive breakout soon!
BTC has formed an invert head and shoulders pattern indicating a reversal. All technical indicators are bullish. We are facing heavy resistance around $8,500.
- We have crossed over the EMA which is a bullish signal. - Our next move is to break out of the downward channel forming from May 5th in a positive direction. - Low volume - possibility to stay in the channel longer - RSI is trending upwards - MACD Opening Up
- Expect fall to $5,500 major support levels - Soon to test the $6,000 support level - Supports are positioned on RSI, MACD, and trend lines for a strong bounce off the $5,500 support if $6,000 support breaks - The is a very healthy correction for the market - Dollar Cost Average your way into positions. Make some money off of this dip!
Bullish Scenario: - Triple bottom has completed - We consolidate for a few days around this price before reversal. - Buy Zone as indicated is $6625-$7000 - RSI level 30 acts as strong support in history Bearish Scenario: - If we reach final support at $6457, we would break formation and could expect lower prices.
- About a 20% chance for a run to test the $7750 resistance at max before retracing to $7050-$7450 Buy Zone. - 20 day moving average is acting as a strong resistance. - About an 80% chance for a downward breakout from the ascending channel that has formed, & another retracement to the ascending support 'buy zone'. - The course could...
- Expect reversal to lower levels - Tested and rejected by $7,700 resistance - Facing descending resistance - 20 Day Moving Average acting as resistance
- Possibility for a run to test the $8000 descending channel resistance at max before retracing to $6800-$7400 Buy Zone. - Testing the downward channel resistance is not necessary in order to reach the buy zone - We are facing strong resistances; we need a strong bounce off $6800-$6900 for bullish reversal
- A strong bounce off the ascending support is necessary in order to break through the descending resistance, and 20,50,200 day moving averages. - A break above $8,000 is needed for bullish reversal - A downward channel has formed, leaving possibilities for bullish reversal in the $7,000-$7400 buy zone.
Tron has been looking very strong over the past week. A strong uptrend has formed, as we are sitting above the 50 day MA (bullish). RSI and MACD are neutral, but are currently angled towards the bullish territory. I expect a HUGE run, and a huge correction (similar to EOS main net launch). TRX is a great long-term hold as well, so investing in this coin now before...
- We have three support levels in order: $567, $470, $395 - Support #1 is weak. - Expect a 61.8% fib retracement at min - Support #3 is in the double bottom zone which would indicate a bullish reversal


