on daily chart we see a double bottom. for confirmation must broke the neck line.
we have both double top and ascending triangle. to see what happens , we must control both the resistance and support zone. if we break support zone double top will work and if we break resistance zone (in the triangle) ascending triangle will work. lets see what will happen
upper red lines are the targets. can try with %5 stop-loss
head and shoulder @usdjpy and still waiting for abcd target
ascending triangle on edobtc. blue line is the target. any price under the triangle ( candle closing) is stop-loss
broke the triangle, targets are the line above
symmetrical triangle and double top neck line broke at the same time. lets see if we ban reach the targets
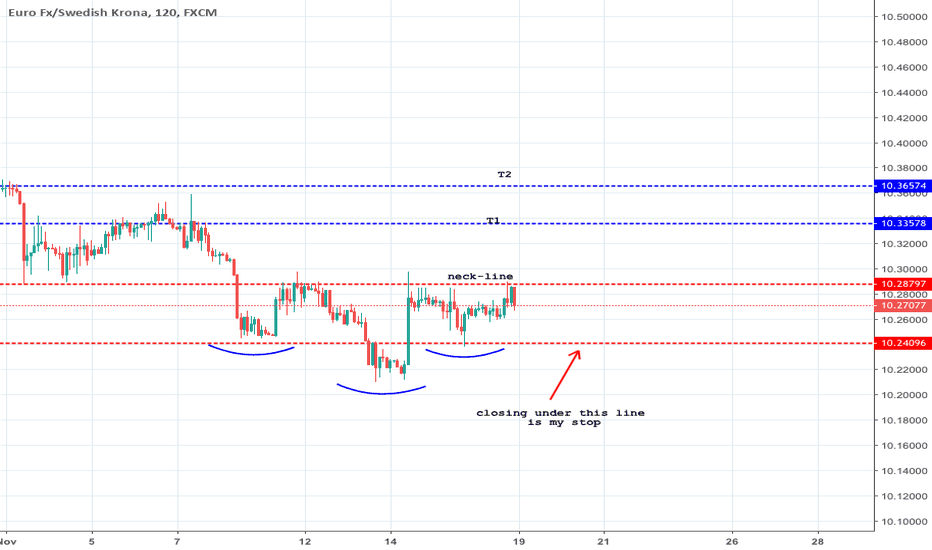
ascending triangle and not confirmed inverse head and shoulders. anywhere under the triangle is my stop.
there is a possible head and shoulders. for confirmation, need to close a candle above the neck-line. until the closing above the neck-line I do not open a position
if we close a daily candle on the red zone I am bullish. of course must follow the btc chart too
we see a double top on the resistance zone of EurJpy. for confirmation we must wait to break the neck-line. the top and bottom of support zone are the targets. out of resistance zone is the stop-loss
there is a confirmed double top. let see if we can reach the targets
we see a descending triangle at bch-xbt. with the closing under the blue support area, I am planning to opening a short position. the target is as shown
USDJPY double top. waiting for a close below 110.7 . 109,973 first target and 109,617 second target
From the last red candle on the tren line,( 127,968) I entered the long position by x200


