ThinAir
btc is in a triangle, break to the upside with target 9750 USD very likely
Here we have 25 period Aroon indicator on the daily bitcoin chart. This indicator indicates whether we are trending downward or upward, and also, how strong the trend is. if you see during the whole bull-run of oct-nov-dec of last year the "Aroon Up" signal was maxed on daily, and after the all time high of 20K it had never peaked Up to now! so now that Aroon up...
for the past couple of days we have kept creating the same bear flag / bearish pennant and breaking it to the downside
EMA 200 is a major support but btc is doing the same thing that it did with the other support levels, i.e creating a bearish pennant/flag before falling down with strength, I expect the same on this current support level as well (EMA200)
A couple of hours earlier we had exactly the same 3 candle arrangement as of now, is this another bear flag, meaning that we are going down again?
The hourly RSI indicator haven't been so oversold since the major crash of Feb 5, What do you think it means?
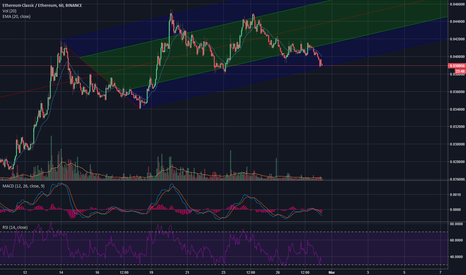
Here you see the uptrend channel that is formed for the ETC/ETH pair recently and price have been playing nicely within the ranges of the channel. Right now price is at the bottom of the channel and we can enter a long position if a nice bounce at this location happens (preferably 4h candle with good volume) Entry: the top of the green candle (if formed) Stop...


