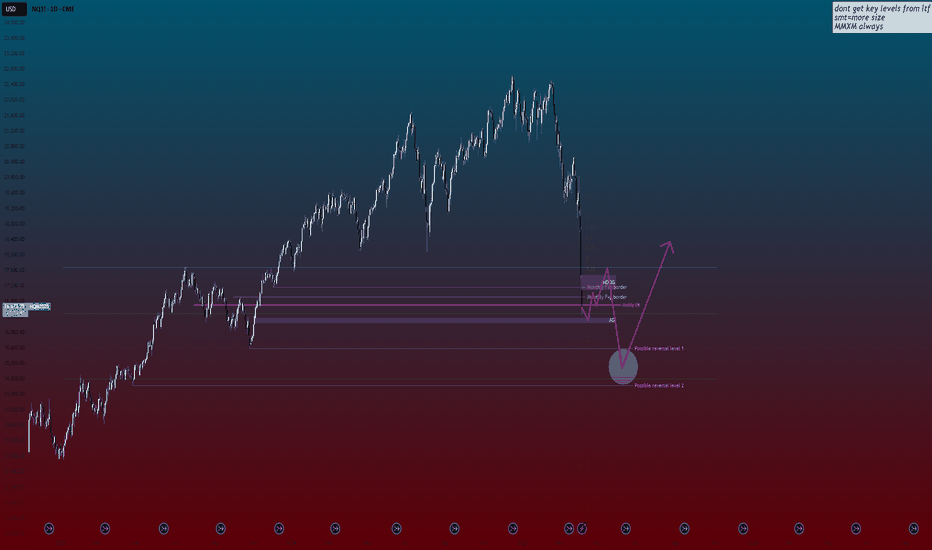
I hate to say I told you but I warned about this crash at my analysis back at September 2024 for NQ1! (you can see it at related ideas below), anticipating market moves based on structure well before the narrative around election and tariffs even began circulating. We often see markets engineer these kinds of dramatic dives below obvious lows. This projection...
The overall trend is still bullish, but the market needs to rebalance at $86,686 before it can push to new highs. Right now, the price action is not respecting bullish structure and is moving sideways in a consolidation phase. The market does not move in a straight line. Every strong move needs to be balanced before continuing. The price left behind...
You most likely already know that most retail traders lose money. With the fear of new cost efficient AI news most people shorted NVIDIA. Whatever the name of the AI and whichever the country it is and however efficient it is, it will still run on hardware and as of now NVIDIA is the biggest hardware maker. This is the chance to buy since price did not go down...
MMSM identified and we're almost certain BTCUSD [ BITSTAMP:BTCUSD ] will hit 87,800$ this week. If we respect the first OB we should pass 100K. If we fail to displace (fast move) after reaching the OB, we could see it go lower to the next OB. Respecting the OB: Means we displace after reaching the OB. If we are bullish We don't want, No Chart Timeframe (in...
While many switch to a bullish bias for CME_MINI:NQ1! because of expectations of a interest rate cut on 18th of September, I remain bearish because markets price in before these events and the rate cut was expected for a long time. We see on the daily chart a double bottom, which is market makers' favorite liquidity to take out. Again on the daily chart, we...
As we head into the trading week, let’s zero in on some critical levels on the CME_MINI:NQ1! Nasdaq that are making the rounds in savvy financial circles. With a bit of a bearish vibe from the get-go, understanding these might just set the stage for some strategic plays. Top Tier: 19,300 to 19,400 Keep your eyes peeled on this upper bracket. It's where the...
The price fluctuated by more than 5% prior to the New York session, an atypical occurrence that suggests increased risk for the week ahead. Volatility exceeding 130 should be regarded as a cautionary signal. It may be prudent to reduce trading risks this week This significant drop could be due to concerns that if the USA election results in a Trump victory, the...
Detailed explanations are given in the chart. Comment if you have any questions. Thanks for reading and good trading!
Based on the information provided, the gold price has been rallying due to fears of a global banking crisis, fueled by the Credit Suisse scandal. Although the situation has calmed down for now, the trust in banks has been severely damaged. There are two possible scenarios for gold price moving forward, with the bullish scenario represented by the blue line and...
Based on the information provided, the price has been range-bound for the last 80 days. Additionally, the last range lasted for 120 days before breaking out. This suggests that the current range may continue for some time, and traders should exercise caution when considering trading opportunities. The technical analysis includes two scenarios: a bullish scenario...
The recent price action of gold has been intriguing to many market participants, with a sharp decline in prices followed by a relatively swift recovery. A closer look at the technical indicators reveals that gold has indeed bounced back from the Anchored Volume Weighted Moving Average (AVWMA) and is now poised to head towards a state of imbalance. The AVWMA, a...
The BIST100 index recently experienced a trendline break, failing to reach the previous trendline and forming a lower angle trendline. This new trendline is showing signs of weakness, as evidenced by the formation of a double top pattern. Given these indicators, it is likely that the BIST100 will experience another trendline break, potentially leading to a...
Natural gas (XNGUSD) is currently trading near key support and resistance levels. The near-term support and resistance levels are important to watch, as they can provide insight into the direction of the commodity’s price. 15M Chart:
Price action has recently moved up from the lower bound of the chart, however, given the current apprehensive sentiment among retail investors and the impending elections, it is unlikely that we will reach the upper bound of the chart in the near future. 15m chart:
Currently, the price is ranging within a certain range, however, the trendline has been broken which suggests that a downward move may be more probable. It is important to note that trendlines are a visual representation of support and resistance levels and the break of a trendline can indicate a change in the market trend. In this case, traders should be cautious...
It was a significant drop in price today, however, there is a demand zone that may provide some support. While it is uncertain if this level will hold, it is possible that we may see a small rally at this point. It is important to closely monitor the price action and volume at this demand zone to gauge the strength of the support.
Following the substantial decline in price today, it is expected that we may see a retracement. This is a common occurrence after a large price movement and is often an opportunity for traders to enter the market or adjust their existing positions. It is important to carefully analyze the price action and consider multiple factors, such as market trends,...
CHoCH and BoS detected on the 1H timefrime NAS100, stoploss and target levels set by fib extension levels.


