Hi people usoil is giving bullish signals since last week we think its time ;)
keep longing it untill it breaks the trendline. if it breaks below I will give a new call ;)
Could go up from marked green region. Keep SL at previous resistance. and R:R = 1:1 Thanks :)
Our old friend Etherium could go down and test 1500 zone again. keep your sl moving and take multiple TP's along the way :)
USDJPY tested lower trendline long on 20 March. could take a bit of correction from the current resistance ahead and then breakout. :)
News about to hit be careful with this one only use small lots. Enter if it breaks 1.07600
Eur usd could break on either side but if it breaks down we could attempt a short keeping R:R 1. Also if it breaks above we will cancel the trade and look for new setup.
Entry : CMP SL : 0.0081 TP1 : 0.015125 Tp2 : 0.017297 Tp3 : 0.019469 Tp4 : 0.022561 Tp5 : 0.0265 injoy :P
USDJPY currently testing a falling resistance if this red candle completes we could go low to themarked regions on the chart as TP1 and TP1 Stay happy and keep trading :)
UsTech / US100 Analysis on yearly basis (It always seems to go in range arround end of the year and then new rally next year)
Double Top for USDT on one day. time for crypto to go up :P
UStech analysis 1D. It retraces twice about 62% now 78.6%. Making a bullish flag and could go up if it breaks this level. otherwise we could see a downtrend from here.
Buy Ustech and aim for the target level defined :)
EURUSD will go up buy. Trying to make Ab=CB and a bullish Flag.
GBPCAD Could go low. from here ;). Its making a bearish Flag. also could retrace on Fib Levels.
AUDUSD Long opportunity with tight stop loss TAke profits on Fib levels or so
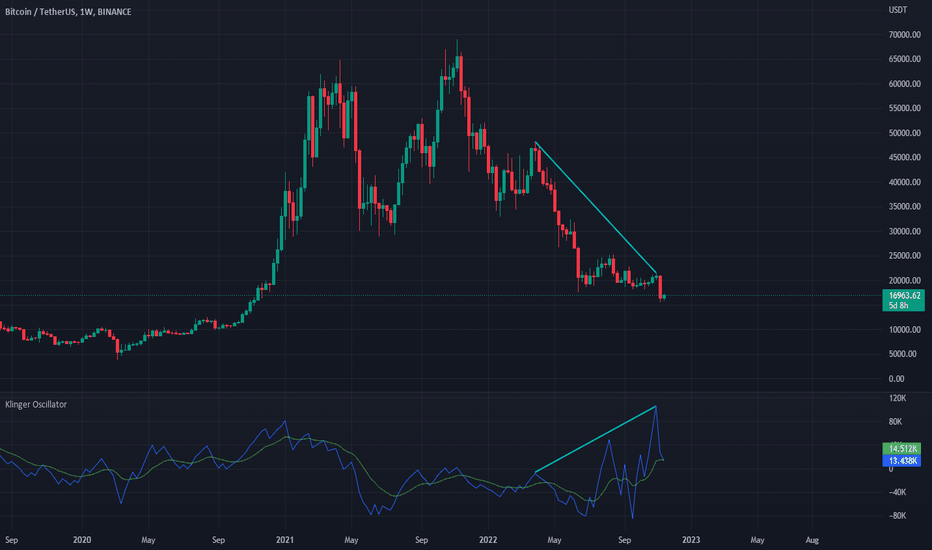
BTC Divergence of the Century on a weekly chart. Lets wait for it to break.
BTC double bottom on One Day chart. Could long from here till next resistance zone.


