usoil Trend Reversal broke previous local high and on its way to bullish trend.
Our good old friend Doge Potential reversal using XABCD on 4h timeframe and strong resistance.
BTC wait for breakout its a falling wedge. TP at next resistance
BTC double top at 1H SL: just ablove the top TP: 50% of fib
Btc Double bottom at 1H chart. Buy if ut breaks above 21400. SL 20700 TP 22000
BTC bearish Flag, updated with divergence on 1D timeframe.
BTC Bearish Flag. Lets hope it dosen't close below the line of hope :D
BTC 4H Bearish Divergence seen on 4H chart. Came down from there and currently inside a rectangle. Lets see where it breaks and we take Longs or Short
Us500 making a beautiful trendline. Long when green candle completes near the trandline. Short if it breaks the trendline with red candle. could go to 4425 (FIB 78.6)
Short If it breaks below the rising wedge. Take targets of -8.5 from current price (Base on flag pole). Daily and 4H Support / resistances are important.
If it breaks below Flag short from there. Target and SL set. Risk/Reward = 2.5
Could bounce from 0.5 FIb (Strong 4H support also there). Look for candle closing and then decide. We let the markeet open
1) Fibonachi Levels Playing perfectly. 2) Rising wedge already broken just as I predicted in my last chart. 3) If we break previous high of 24700 well go to $25000-26000 easily 4) Made 2 targets based on Fib 1 and 1.618. 5) Risk Reward 1:1 6) enjoy :)
ETH hourly review. looks bullish with a bullish sign, but it has entered a strong resistance zone
BTC 1H update (With a beautiful trtendline) Could Wait for candle pattern to confirm
-> sell short if breaks below 24350. -> Target at 24000. 1) Fib 0.382 2) Support level 3) bearish Flag pole length Risk Reward 1:2
BTC wants to breakout. Please wait for confirmation.
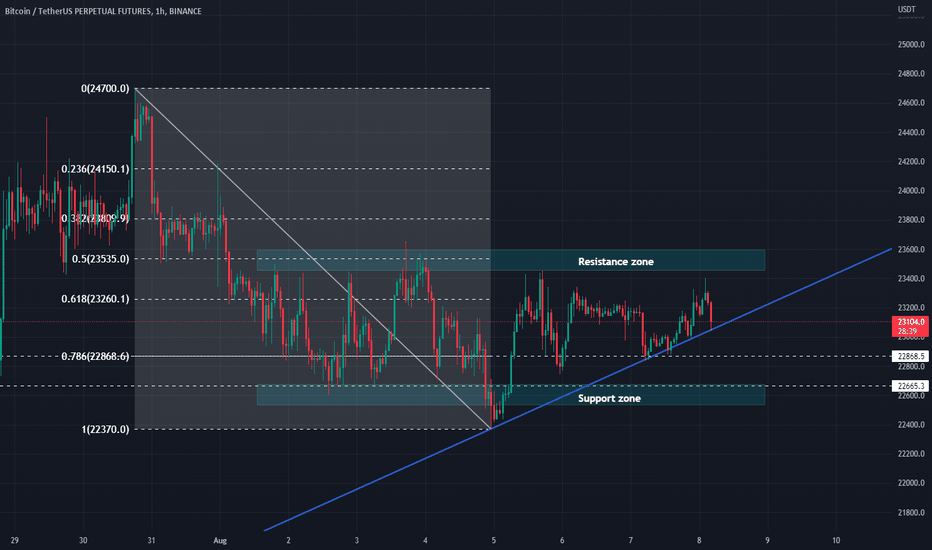
BTC hourly chard update. Rising trend line and two support and resistance zones identified. FIB 78.6 Support working


